(2: 中国科学院南京地理与湖泊研究所, 湖泊与环境国家重点实验室, 南京 210008)
(3: 湖南省岳阳市农业科学院水产研究所, 岳阳 414000)
(2: State Key Laboratory of Lake Science and Environment, Nanjing Institute of Geography and Limnology, Chinese Academy of Sciences, Nanjing 210008, P. R. China)
(3: Fisheries Research Institute, Yueyang Academy of Agricultural Sciences in Hunan Province, Yueyang 414000, P. R. China)
由于自然过程、人类活动等原因,湖泊生态破坏日益加重,并出现了生态环境退化、生物多样性降低等问题,水生态系统健康状况受到严重威胁[1-2]. 因此,国内外均积极开展水域生态系统监测和健康评估工作[3-5],但有关研究大多基于理化因子(如单因子和富营养化指数)以及水生生物的多样性指数等[6-7]. 与化学或物理指标相比,生物群落是对水体中各种物理、化学、生物因子的综合和直接反映,更能体现水生态健康状况[8-9]. 浮游植物作为水生态系统的初级生产者,生活周期短且对水环境变化反应敏感,常被用于指示生态系统健康状况[10].
根据浮游植物生理、形态和对环境响应机制等特征,Reynolds等[11]和Padisák等[12]共划分出39个功能群(function group, FG),各功能群反映特定的生境类型. 基于功能群,Padisák等提出Q指数来评估水生态系统健康状况,并得到广泛应用[13-14]. 如高国敬等[15]指出相较于传统的卡尔森营养状态指数评价,Q指数可以避免丰水期降雨带来的干扰,从而更为准确地评估海南省水库生态状态. 此外,多指标体系法也常用于评估水域生态系统健康状况[16-17]. 其中,生物完整性指数(IBI)综合了多项群落结构指标,是多指标体系法的重要内容[18]. IBI首先以鱼类作为研究对象,而后应用到大型底栖无脊椎动物[19-20]和附着藻类[21]等. 近年来,研究者开始关注浮游植物生物完整性指数(P-IBI),如蔡琨等[22]运用总分类单元数、硅藻门分类单元、Simpson指数等6个指标构建P-IBI,对太湖生态系统进行了评价.
由于生态系统的差异性,针对特定研究区域建立切实可行的评估体系显得尤为重要. 城市湖泊生态系统的自身独特性——水流缓慢、水容量小且自净能力差,使之难以确立未受干扰的参照点[23],如何构建其生态健康评估体系仍需进一步研究. 铜陵西湖作为城市总体规划的基础,位于铜陵市西湖新区中央,环绕西湖规划有大型市级文化、体育运动场馆和行政办公场所[24-26]. 由于受人类活动干扰较大,且有关的水生态状况资料极少,不利于铜陵西湖的生态健康评估和保护. 因此,本研究在确立铜陵西湖浮游植物群落结构现状的基础上,运用Q指数和P-IBI对其进行生态健康状况评估,以期为相关城市湖泊的P-IBI构建以及生态健康评估、保护和修复等提供一定的科学依据.
1 材料与方法 1.1 研究区域与样点布设铜陵西湖湖区面积约1.61 km2. 根据地形等特征,本研究在湖区共布设4个点位(图 1),于秋(2016年9月和11月)、冬(2017年1月)、春(2017年3月和5月)、夏(2017年7月)四季开展6次水环境和浮游植物调查.

|
图 1 铜陵西湖采样点分布 Fig.1 Distribution of sampling sites in Lake Xihu (Tongling) |
现场使用多参数水质监测仪测定水体表层温度(WT)、电导率(Cond)、酸碱度(pH)、浊度(Tur)和溶解氧(DO),使用塞氏透明度盘测定水体透明度(SD),总氮(TN)、总磷(TP)、亚硝态氮(NO2--N)、硝态氮(NO3--N)、氨氮(NH3-N)、悬浮颗粒物(SS)和高锰酸盐指数(CODMn)参照《水和废水监测分析方法》测定[27],叶绿素a(Chl.a)用热乙醇法测定[28].
浮游植物定量样品取混合水样1 L,加入1 % 体积的鲁哥试剂固定,静置48 h后,浓缩定容至30 mL,在光学显微镜下进行种类鉴定和计数. 浮游植物种类鉴定参照《中国淡水藻类:系统、分类及生态》[29]. 每个样品计数重复3次,取其平均值(误差范围小于±15 %),生物量(Biomass)测定采用体积转化法.
1.3 功能群Q指数Q指数计算公式如下:
| $ Q=\sum\limits_{i=1}^n\left(\frac{n_i}{N} \cdot F_i\right) $ | (1) |
式中,n为浮游植物功能群的数量,N为总生物量,ni为第i个功能群的生物量,Fi为第i个功能群的赋值. 依据Q指数将水生态健康状况划分为5个等级:0~1为“极差”,1~2为“较差”,2~3为“中等”,3~4为“良好”,4~5为“优秀”[13, 30].
1.4 浮游植物生物完整性指数铜陵西湖P-IBI的建立分两步:构建和测试[31],本研究将前4次和后2次数据分别用于P-IBI构建和测试. 参照国内外P-IBI研究实例[22, 32-35],选取25个常用于反映浮游植物群落结构特征的指标作为候选参数. 除Biomass和Chl.a外,其他参数均基于密度计算. 基于累计决定系数(Cumulative_R2)和相关指数(CoI),确立构建P-IBI的核心生物参数[8, 36]. Cumulative_R2和CoI分别如(2)和(3)所示.
| $ \text { Cumulative_ } R^2=\sum\limits_{i=1}^n r_{s, i}^2 $ | (2) |
式中,rs, i为候选参数和环境因子i之间的Spearman相关系数,n为环境因子的数量.
| $ { CoI }=\frac{\left(\text { Cumulative_ } R^2 \cdot S\right)}{n^2} $ | (3) |
式中,S为P < 0.05的rs, i数量. Cumulative_R2的范围为0~n,CoI值范围为0~1,数值越大,代表候选参数与环境因子的相关性越高.
此外,本文还通过计算营养硅藻指数(TDI)[37]、种群质量指数(QGS)[38]、蓝藻指数(CyI)[39]、运动性硅藻百分比(PMD)[40]和综合营养状态指数(TLI)[41]来验证所构建P-IBI的适用性. P-IBI核心参数均进行1~5的标准化,其均值即为最终的P-IBI得分. P-IBI等级划分标准同Q指数[42-43].
1.5 数据分析浮游植物群落与环境因子的冗余分析使用R 4.0.3完成,由程序包vegan实现. 单因素方差分析由SPSS 22.0软件完成.
2 结果与分析 2.1 理化因子与浮游植物群落结构特征 2.1.1 理化因子铜陵西湖水体呈弱碱性,TN月均值变化范围为3.89~6.16 mg/L,而TP月均值介于0.13~0.30 mg/L之间. 与TP一致,CODMn均值在2017年7月最高,2016年11月最低. NO2--N和NO3--N月均值范围分别为0.02~0.64和0.65~3.81 mg/L,两者均在2017年5月最高. NO3--N和Chl.a月份均值范围分别为0.51~4.03 mg/L和0.62~124.57 μg/L. 空间上,各理化因子值差异均较小,其中TN浓度均值变化范围为4.54~5.95 mg/L,在1#点位浓度最高,其次为2#点位. 与TN一致,1#和2#点位的TP浓度较高.
2.1.2 浮游植物种类组成调查共发现浮游植物88种,隶属于6门45属. 绿藻门种类最多,共有35种(39.77 %);其次是裸藻门(26.14 %);蓝藻门和硅藻门各发现12种和11种;隐藻门和甲藻门种类数均较少,共占总种类数的7.95 %. 优势种为铜绿微囊藻(Microcystis aeruginosa)、浮游蓝丝藻(Planktothrix sp.)和微囊藻(Microcystis sp.),优势度分别为0.13、0.044和0.035.
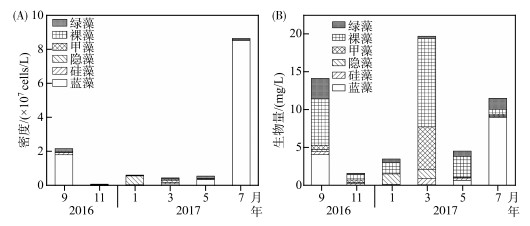
2.1.3 浮游植物密度和生物量时空变化时间上,浮游植物总密度和蓝藻密度均在2017年7月最高,分别为8.63×10⁷和8.51×10⁷ cells/L(图 2A),最低值分别为1.13×10⁶和2.16×10⁵ cells/L,且均出现在2016年11月. 此外,蓝藻对2016年9月和2017年5月的总密度贡献同样较大,相对密度分别为83.51 % 和63.89 %. 隐藻相对密度在2017年1月超过80 %. 裸藻和甲藻密度均在2017年3月最高. 与密度不同,生物量最高值出现在2017年3月,为19.60 mg/L(图 2B). 裸藻是引起总生物量时间差异的主要原因,其次是蓝藻和甲藻.
|
图 2 铜陵西湖浮游植物密度(A)和生物量(B)时间变化 Fig.2 Temporal variations of phytoplankton density (A) and biomass (B) in Lake Xihu (Tongling) |
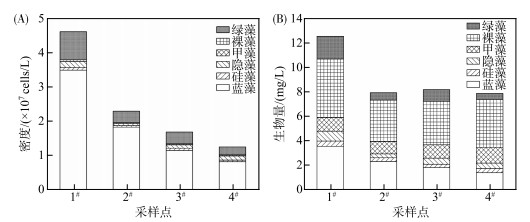
空间上,浮游植物密度最高值出现在1#点位(4.60×10⁷ cells/L),且多个门类密度均在该点位最高,最低值出现在4#点位(图 3A). 浮游植物平均生物量为9.11 mg/L,最高值和最低值同样分别出现在1#点位(12.50 mg/L)和4#点位(7.86 mg/L,图 3B). 密度方面,蓝藻占绝对优势,相对密度为65.58 % ~79.69 %. 裸藻对生物量的贡献较大,相对生物量为37.97 % ~49.47 %.
|
图 3 铜陵西湖浮游植物密度(A)和生物量(B)空间变化 Fig.3 Spatial variations of phytoplankton density (A) and biomass (B) in Lake Xihu (Tongling) |
铜陵西湖浮游植物可归纳为22组功能群,通过频率分析,功能群B、J、LO、M、P、S2、W1、X1、Y的出现频率均大于50 %,为常见功能群;功能群D、G、MP、S1、W2、X2的出现频率均为20 % ~50 %,仅出现在其适宜的生态环境;功能群LM、N、T、TC的出现频率均小于5 %,为罕见功能群.
2.1.5 功能群时空变化选择相对生物量超过5 % 的浮游植物功能群为该时期的优势功能群,超过50 % 为绝对优势功能群. 优势功能群随时间演替趋势为:W1+S2+G(2016年9月)→W1+LO+P+Y(2016年11月)→W1+Y+P+X2(2017年1月)→W1+LO+Y(2017年3月)→W1+S2+J+W2(2017年5月)→M+S2+G(2017年7月)(图 4A). 功能群W1基本占据优势地位,且在2017年3月和5月占绝对优势,相对生物量分别达到59.2 % 和53.8 %.

|
图 4 浮游植物优势功能群相对生物量时间(A)和空间(B)变化 Fig.4 Temporal (A) and spatial (B) variations of relative biomass for phytoplankton dominant functional groups |
空间上,W1、S2、M、LO、Y、G和H1为优势功能群,功能群W1是各点位的主要优势类群(图 4B),相对生物量介于36.8 % ~46.9 % 之间,主要代表性藻属为裸藻属、鳞孔藻属和扁裸藻属.
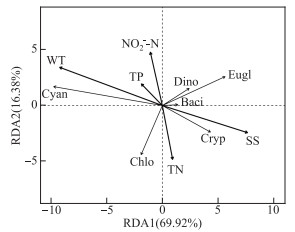
2.2 浮游植物与环境因子的关系选取铜陵西湖浮游植物各门类生物量及14个环境因子,进行去趋势对应分析(DCA),结果表明排序轴长度小于3. 经RDA分析确定出具有显著解释性的环境因子为WT、SS、TN、NO2--N和TP(图 5). 第一、第二排序轴特征值分别为0.1566和0.0367,累计解释了86.30 % 的生物量信息. 此外,第一排序轴与SS、TN呈正相关,与WT、NO2--N、TP呈负相关;第二排序轴与WT、NO2--N、TP呈正相关,与SS、TN呈负相关.
|
图 5 铜陵西湖浮游植物生物量与环境因子的RDA分析 (Cyan: 蓝藻门; Chlo: 绿藻门; Baci: 硅藻门; Cryp: 隐藻门; Eugl: 裸藻门; Dino: 甲藻门) Fig.5 RDA analysis of phytoplankton biomass and environment factors in Lake Xihu (Tongling) |
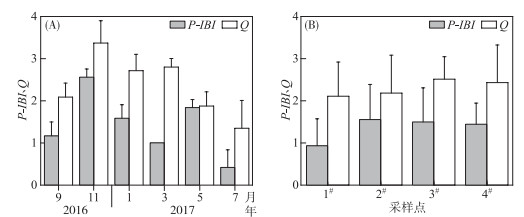
从Q指数来看,铜陵西湖整体处于“中等”状态. 时间上,Q指数平均值变化范围为1.27~3.18,2017年5月和7月Q指数较低,为“较差”状态;2016年11月Q指数相对较高,为“良好”状态(图 6A). 空间上,Q指数介于2.04~2.43之间,最低值出现在1#点位,最高值出现在3#点位(图 6B).
|
图 6 铜陵西湖P-IBI 和Q指数的时间(A)和空间(B)变化 Fig.6 Temporal (A) and spatial (B) variations of the P-IBI and Q index in Lake Xihu (Tongling) |
根据构建阶段的数据库,分析本研究中14个环境因子之间的相关性,结果表明各因子间无显著相关性,因此均用于CoI和Cumulative_R2计算中(表 1).
| 表 1 浮游植物生物完整性指数的候选参数和其它单项参数的相关系数(CoI)与累计决定系数(Cumulative_R2) Tab. 1 The correlation index (CoI) and the Cumulative_R2 values of selected and excluded indices for the phytoplankton index of biotic integrity (P-IBI) and other single indices |
根据构建阶段的CoI值排序,选出前10个候选参数,即Biomass、Chl.a、物种丰富度(Species richness)、有效物种数(Hill N0)、Kothe指数、密度(Density)、Gleason指数、Margalef指数、Fisher指数和Odum指数. 综合考虑这10个候选参数构建与测试阶段的CoI和Cumulative_R2值,选出排名前5的参数,分别为Biomass、Chl.a、Density、Margalef指数和Gleason指数. Biomass和Chl.a均代表生物量,但前者的CoI和Cumulative_R2值均高于后者. 此外,虽然Margalef指数和Gleason指数的CoI值和Cumulative_R2值一致,但Margalef指数广泛用于生态状况评估. 因此,本文最终选用Biomass、Density和Margalef指数构建铜陵西湖P-IBI,其标准化方法参考沈治蕊[44]、况琪军[10]和詹玉涛[45]的评价标准(表 2). 与其他单项评估指标相比,P-IBI的CoI和Cumulative_R2值均远大于其它单项指标.
| 表 2 用于P-IBI计算的参数标准化方法[10, 44-45] Tab. 2 Normalization factors of the indices used in the calculation of the P-IBI[10, 44-45] |
从整体来看,P-IBI均值为1.38,以“较差”状态为主(占所有数据的47.83 %),其次是“极差”状态. 2016年11月P-IBI均值为2.56,水生态状态最佳(“中等”),其他月份均处于“较差”或“极差”状态,特别是2017年7月(均值为0.42,图 6A). 空间上,1#点位P-IBI均值为0.93,处于“极差”状态,其他点位均处于“较差”状态(图 6B).
P-IBI与Q指数呈显著正相关(r=0.61, P < 0.05; 图 7). 时间上,两者均指示秋季(2016年11月)水生态状况最佳,夏季最差. 空间上,1#点位P-IBI与Q指数均低于其他点位. 但是,各点位和各月份的Q指数均值都高于相对应的P-IBI均值.
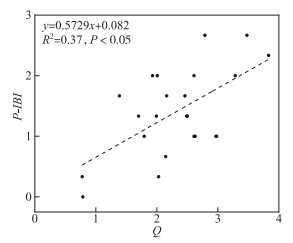
|
图 7 铜陵西湖P-IBI与Q指数的相关关系 Fig.7 Relationship between the P-IBI and Q index in Lake Xihu (Tongling) |
浮游植物生长及群落结构演替主要受光照、温度、营养盐等影响[46-47]. 浮游植物适宜的生长温度因种类而异,一般情况下,蓝藻、绿藻喜高温,硅藻、隐藻嗜低温[48]. 铜陵西湖浮游植物密度峰值出现在夏季,水温较高造成浮游植物(特别是蓝藻)较快生长. 最高生物量出现在春季(2017年3月),且在秋季(2016年9月)取得另一峰值,这可能是由于该水体春秋季节适宜个体较大的裸藻和甲藻生长,并成为优势种. 悬浮物通过降低水下光照条件,阻碍光的传递,间接影响浮游植物生长[49-50]. 本研究中,隐藻和裸藻生物量与SS呈正相关,可能表明这两个门类对低光有一定的适应能力,且悬浮物可能会携带一定量的有机质,从而促进其门类细胞的生长[51]. 此外,营养盐的不足或过量都会影响浮游植物的生长和群落结构[52].
3.2 城市湖泊生态健康状况评价湖泊生态健康评价方法主要分为两类:生物监测法和多指标体系评价法[16-17, 53]. 基于浮游植物,本文选取Q指数,并构建P-IBI评估体系,通过这2种指数评估铜陵西湖生态健康状况. 基于浮游植物功能类群及其对环境响应机制特征等,Q指数能较准确地评价水生态状况[30]. P-IBI代表了群落组成与结构,能定量描述人类干扰与生物特性之间的关系,包含多种对人类干扰敏感的一组生物指标,并将其综合成一个数值[54]. IBI分为先验法和后验法[55],参照点的选择是先验法的核心,但由于城市湖泊受人为活动影响严重,很难找到原始或未受干扰的区域作为参照点. 后验法通过对候选参数做多变量分析,利用统计工具克服参照点的不足[32, 55-57],适用于城市湖泊等受人类干扰较大水体的生态健康状况评价.
本研究以铜陵西湖为例,根据候选参数与环境因子的相关性,选出Biomass、Density和Margalef指数作为核心参数. Biomass[34, 58]、Density[22, 32, 42]和Margalef指数[34, 42-43]广泛用于P-IBI评价体系构建,且常作为单项指标评价生态状况. P-IBI评价结果显示,铜陵西湖秋季(2016年11月)生态状况最佳而夏季最差,这与Q指数评价结果一致. 此外,P-IBI与Q指数呈显著正相关,在一定程度上说明浮游植物可以有效用于铜陵西湖生态健康状况评估. 但在时空尺度上,P-IBI均低于Q指数,表明其评价结果更为严格. 时间上,两者变化趋势的差异主要表现在2017年3月,P-IBI和Q指数均值分别为1.00和2.80,主要由于2017年1--3月总生物量急剧升高,其中,隶属于赋分较高的功能群LO和W1相对生物量分别增加了22.93 % 和16.99 %,导致P-IBI降低而Q指数升高.
当前,我国城市湖泊的健康评价多集中于水质和水生生物多样性指标[55]. 以TN、TP和CODMn为主要评价指标,铜陵西湖依次处于劣Ⅴ类、Ⅴ~劣Ⅴ类、Ⅲ~劣Ⅴ类水质,与前人研究结果基本一致[25-26]. 然而,从DO和NH3-N来看,铜陵西湖水质分别处于Ⅰ~Ⅲ类和Ⅲ~劣Ⅴ类,各指标评价结果差异较大. 从3种常见的多样性指数来看,Shannon-Wiener指数、Margalef指数和Pielou指数均值依次为1.59、0.94和0.58,分别表明铜陵西湖处于中污染、重污染和轻污染状态. 时间上,单一指数间的评估结果跨度也较大,以11月为例,上述3种指数依次显示铜陵西湖处于清洁、中污染、重污染. 由此可见,单一水质和多样性指标无法准确评估铜陵西湖的生态状况. 此外,李茜等[59]研究表明,单因子评价法中各因子互不联系,无法全面反映水体状况. 顾毓蓉等[55]研究也指出,由于生物多样性忽略了不同物种对干扰的耐受性和生态保守性,无法真实反映城市湖泊的生物完整性. 因此对于城市湖泊,应综合考虑水生生物的多项指标,构建合理的评估体系,从而较为准确地反映其水生态健康状况.
4 结论本文以铜陵西湖为例,利用浮游植物评价其生态健康状况. 结果表明,浮游植物密度和生物量均值分别为2.19×10⁷cells/L和9.45 mg/L,WT、SS、TN、NO2--N和TP是影响生物量的主要环境因子. 基于功能群的Q指数表明,铜陵西湖整体处于“中等”状态. P-IBI由Biomass、Density和Margalef指数构成,其与Q指数均可有效评估铜陵西湖生态健康状况,但P-IBI结果(整体为“较差”状态)更为严格. 时间上,两者均表现出秋季(2016年11月)水生态健康状况最佳,而夏季最差. 空间上,P-IBI与Q指数均在1#点位最差(“中等”状态).
| [1] |
Ho JC, Michalak AM, Pahlevan N. Widespread global increase in intense lake phytoplankton blooms since the 1980s. Nature, 2019, 574(7780): 667-670. DOI:10.1038/s41586-019-1648-7 |
| [2] |
Yang GS, Ma RH, Zhang L et al. Lake status, major problems and protection strategy in China. J Lake Sci, 2010, 22(6): 799-810. [杨桂山, 马荣华, 张路等. 中国湖泊现状及面临的重大问题与保护策略. 湖泊科学, 2010, 22(6): 799-810. DOI:10.18307/2010.0601] |
| [3] |
Romero E, le Gendre R, Garnier J et al. Long-term water quality in the lower Seine: Lessons learned over 4 decades of monitoring. Environmental Science & Policy, 2016, 58: 141-154. DOI:10.1016/j.envsci.2016.01.016 |
| [4] |
Wu ZS, Lai XJ, Li KY. Water quality assessment of rivers in Lake Chaohu Basin (China) using water quality index. Ecological Indicators, 2021, 121: 107021. DOI:10.1016/j.ecolind.2020.107021 |
| [5] |
Tan Q, Ma QQ, Li BB et al. Ecological health assessment of the upper reaches of the Yangtze River, based on biotic integrity index of phytoplankton. Freshwater Fisheries, 2017, 47(3): 97-104. [谭巧, 马芊芊, 李斌斌等. 应用浮游植物生物完整性指数评价长江上游河流健康. 淡水渔业, 2017, 47(3): 97-104. DOI:10.3969/j.issn.1000-6907.2017.03.015] |
| [6] |
Thakur RK, Jindal R, Singh UB et al. Plankton diversity and water quality assessment of three freshwater lakes of Mandi (Himachal Pradesh, India) with special reference to planktonic indicators. Environmental Monitoring and Assessment, 2013, 185(10): 8355-8373. DOI:10.1007/s10661-013-3178-3 |
| [7] |
Liu LF, Zhou XH, Gao J et al. Phytoplankton community structure and trophic status evaluation in Dajiuhu wetland of Shennongjia Alpine. J Lake Sci, 2018, 30(2): 417-430. [刘林峰, 周先华, 高健等. 神农架大九湖湿地浮游植物群落结构特征及营养状态评价. 湖泊科学, 2018, 30(2): 417-430. DOI:10.18307/2018.0213] |
| [8] |
Wu NC, Schmalz B, Fohrer N. Development and testing of a phytoplankton index of biotic integrity (P-IBI) for a German lowland river. Ecological Indicators, 2012, 13(1): 158-167. DOI:10.1016/j.ecolind.2011.05.022 |
| [9] |
Wang BX, Yang LF, Liu ZW. Index of biological integrity and its application in health assessment of aquatic ecosystem. Chinese Journal of Ecology, 2006, 25(6): 707-710. [王备新, 杨莲芳, 刘正文. 生物完整性指数与水生态系统健康评价. 生态学杂志, 2006, 25(6): 707-710. DOI:10.3321/j.issn:1000-4890.2006.06.023] |
| [10] |
Kuang QJ, Ma PM, Hu ZY et al. Study on the evaluation and treatment of lake eutrophication by means of algae biology. Journal of Safety and Environment, 2005, 5(2): 87-91. [况琪军, 马沛明, 胡征宇等. 湖泊富营养化的藻类生物学评价与治理研究进展. 安全与环境学报, 2005, 5(2): 87-91. DOI:10.3969/j.issn.1009-6094.2005.02.024] |
| [11] |
Reynolds CS, Huszar V, Kruk C et al. Towards a functional classification of the freshwater phytoplankton. Journal of Plankton Research, 2002, 24(5): 417-428. DOI:10.1093/plankt/24.5.417 |
| [12] |
Padisák J, Crossetti LO, Naselli-Flores L. Use and misuse in the application of the phytoplankton functional classification: A critical review with updates. Hydrobiologia, 2009, 621(1): 1-19. DOI:10.1007/s10750-008-9645-0 |
| [13] |
Padisák J, Borics G, Grigorszky I et al. Use of phytoplankton assemblages for monitoring ecological status of lakes within the water framework directive: The assemblage index. Hydrobiologia, 2006, 553(1): 1-14. DOI:10.1007/s10750-005-1393-9 |
| [14] |
Zhang H, Peng YQ, Zou XN et al. Characteristics of phytoplankton functional groups and their relationships with environmental factors in Xinfengjiang Reservoir. China Environmental Science, 2022, 42(1): 380-392. [张辉, 彭宇琼, 邹贤妮等. 新丰江水库浮游植物功能分组特征及其与环境因子的关系. 中国环境科学, 2022, 42(1): 380-392. DOI:10.3969/j.issn.1000-6923.2022.01.040] |
| [15] |
Gao GJ, Xiao LJ, Lin QQ et al. Structure of phytoplankton functional groups and water quality assessment of main reservoirs in Hainan Province. Ecological Science, 2013, 32(2): 144-150. [高国敬, 肖利娟, 林秋奇等. 海南省典型水库浮游植物功能类群的结构特征与水质评价. 生态科学, 2013, 32(2): 144-150. DOI:10.3969/j.issn.1008-8873.2013.02.002] |
| [16] |
Tang T, Cai QH, Liu JK. River ecosystem health and its assessment. Chinese Journal of Applied Ecology, 2002, 13(9): 1191-1194. [唐涛, 蔡庆华, 刘建康. 河流生态系统健康及其评价. 应用生态学报, 2002, 13(9): 1191-1194. DOI:10.3321/j.issn:1001-9332.2002.09.031] |
| [17] |
Zhao YW, Yang ZF. River health: Concept, assessment method and direction. Scientia Geographica Sinica, 2005, 25(1): 119-124. [赵彦伟, 杨志峰. 河流健康: 概念、评价方法与方向. 地理科学, 2005, 25(1): 119-124. DOI:10.3969/j.issn.1000-0690.2005.01.019] |
| [18] |
Zhao GN, Pan BZ, Li Y et al. Research progress on phytoplankton and periphyton ecology of the waterbodies in the Loess Plateau. Sichuan Environment, 2021, 40(3): 235-240. [赵耿楠, 潘保柱, 李艳等. 黄土高原水体浮游藻类与着生藻类生态研究进展. 四川环境, 2021, 40(3): 235-240.] |
| [19] |
Wang BX. Water quality bioassessment using benthic macroinvertebrates[Dissertation]. Nanjing: Nanjing Agricultural University, 2003. [王备新. 大型底栖无脊椎动物水质生物评价研究[学位论文]. 南京: 南京农业大学, 2003. ]
|
| [20] |
Huang Q, Gao JF, Cai YJ et al. Development and application of benthic macroinvertebrate-based multimetric indices for the assessment of streams and rivers in the Taihu Basin, China. Ecological Indicators, 2015, 48: 649-659. DOI:10.1016/j.ecolind.2014.09.014 |
| [21] |
Kireta AR, Reavie ED, Sgro GV et al. Planktonic and periphytic diatoms as indicators of stress on great rivers of the United States: Testing water quality and disturbance models. Ecological Indicators, 2012, 13(1): 222-231. DOI:10.1016/j.ecolind.2011.06.006 |
| [22] |
Cai K, Qin CY, Li JY et al. Preliminary study on phytoplanktonic index of biotic integrity(P-IBI) assessment for lake ecosystem health: A case of Taihu Lake in Winter, 2012. Acta Ecologica Sinica, 2016, 36(5): 1431-1441. [蔡琨, 秦春燕, 李继影等. 基于浮游植物生物完整性指数的湖泊生态系统评价——以2012年冬季太湖为例. 生态学报, 2016, 36(5): 1431-1441. DOI:10.5846/stxb201407211483] |
| [23] |
Xiao XY, Long WW, Liu ZW et al. Community structure of phytoplankton and its relationship with aquatic environmental factors in typical landscape lakes of Ji'an, Jiangxi Province. Chinese Journal of Ecology, 2016, 35(4): 934-941. [肖小雨, 龙婉婉, 柳正葳等. 吉安地区典型景观湖泊浮游植物群落特征及其与水环境因子的关系. 生态学杂志, 2016, 35(4): 934-941. DOI:10.13292/j.1000-4890.201604.005] |
| [24] |
Zhu GJ, Tian ZH. Planning practice of green ecological urban area: A study on the planning of West Lake in Tongling. New Area. Construction Technology, 2014(24): 61-64. [朱根节, 田中华. 绿色生态城区规划实践——铜陵西湖新区规划编制研究. 建设科技, 2014(24): 61-64.] |
| [25] |
Wang CF, Wu JH. Current situation of water environment quality of Lake West wetland park in Tongling. Technological Innovation and Application, 2016(26): 150. [王朝飞, 吴建华. 铜陵西湖湿地公园水环境质量现状. 科技创新与应用, 2016(26): 150.] |
| [26] |
Zhong JW, Wu H, Chen YS. Research on urban wetland ecological restoration strategies based on collaborative development—A case study of west lake wetland park in Tongling. Chinese Landscape Architecture, 2020, 36(7): 93-98. [钟嘉伟, 吴韩, 陈永生. 基于协同发展为导向的城市新区湿地生态修复策略研究——以铜陵西湖城市湿地公园为例. 中国园林, 2020, 36(7): 93-98. DOI:10.19775/j.cla.2020.07.0093] |
| [27] |
Editorial Board of Water and Wastewater Monitoring and Analysis Methods, Ministry of Environmental Protection of the People's Republic of China. Water and wastewater monitoring and analysis methods: 4th edition. Beijing: China Environmental Science Press, 2002. [国家环境保护总局《水和废水监测分析方法》编委会. 水和废水监测分析方法: 第4版. 北京: 中国环境科学出版社, 2002.]
|
| [28] |
Chen YW, Chen KN, Hu YH. Discussion on possible error for phytoplankton chlorophyll-a concentration analysis using hot-ethanol extraction method. J Lake Sci, 2006, 18(5): 550-552. [陈宇炜, 陈开宁, 胡耀辉. 浮游植物叶绿素a测定的"热乙醇法"及其测定误差的探讨. 湖泊科学, 2006, 18(5): 550-552. DOI:10.18307/2006.0519] |
| [29] |
Hu HJ, Wei YX. The freshwater algae of China: systematics, taxonomy and ecology. Beijing: Science Press, 2006. [胡鸿钧, 魏印心. 中国淡水藻类: 系统、分类及生态. 北京: 科学出版社, 2006.]
|
| [30] |
Hu R, Lan YQ, Xiao LJ et al. The concepts, classification and application of freshwater phytoplankton functional groups. J Lake Sci, 2015, 27(1): 11-23. [胡韧, 蓝于倩, 肖利娟等. 淡水浮游植物功能群的概念、划分方法和应用. 湖泊科学, 2015, 27(1): 11-23. DOI:10.18307/2015.0102] |
| [31] |
Sang C. Water quality assessment of the Irtysh River in Xinjiang Uygur Autonomous region based on the water quality index(WQI) and the indices of biotic integrity(periphyton and zoobenthos)[Dissertation]. Wuhan: Huazhong Agricultural University, 2020. [桑翀. 基于水质指数与生物完整性指数(周丛藻类和底栖动物)的新疆额尔齐斯河水质评价[学位论文]. 武汉: 华中农业大学, 2020. ]
|
| [32] |
Wu ZS, Kong M, Cai YJ et al. Index of biotic integrity based on phytoplankton and water quality index: Do they have a similar pattern on water quality assessment? A study of rivers in Lake Taihu Basin, China. Science of the Total Environment, 2019, 658: 395-404. DOI:10.1016/j.scitotenv.2018.12.216 |
| [33] |
Xiao SS, Hao YB, Liu JD et al. Aquatic ecological health assessment of Qiantang River Basin in Zhejiang Province by phytoplankton index of biotic integrity. Fisheries Science, 2021, 40(5): 740-749. [肖善势, 郝雅宾, 刘金殿等. 应用生物完整性指数评价钱塘江流域——浙江段水生态系统健康. 水产科学, 2021, 40(5): 740-749.] |
| [34] |
Wang X, Guo KJ, Li XX et al. Construction of phytoplanktonic index of biotic integrity and evaluation of water ecological health in Dianshan Lake, China. Journal of Shanghai Normal University: Natural Sciences, 2021, 50(1): 39-49. [王霞, 郭凯娟, 李晓旭等. 淀山湖浮游植物生物完整性指数的构建及水生态健康评价. 上海师范大学学报: 自然科学版, 2021, 50(1): 39-49.] |
| [35] |
Spatharis S, Tsirtsis G. Ecological quality scales based on phytoplankton for the implementation of Water Framework Directive in the Eastern Mediterranean. Ecological Indicators, 2010, 10(4): 840-847. DOI:10.1016/j.ecolind.2010.01.005 |
| [36] |
Blanco S, Bécares E, Cauchie HM et al. Comparison of biotic indices for water quality diagnosis in the Duero Basin (Spain). River Systems, 2007, 17(3/4): 267-286. DOI:10.1127/lr/17/2007/267 |
| [37] |
Kelly MG, Whitton BA. The Trophic Diatom Index: A new index for monitoring eutrophication in rivers. Journal of Applied Phycology, 1995, 7(4): 433-444. DOI:10.1007/BF00003802 |
| [38] |
Katsiapi M, Moustaka-Gouni M, Sommer U. Assessing ecological water quality of freshwaters: PhyCoI—A new phytoplankton community Index. Ecological Informatics, 2016, 31: 22-29. DOI:10.1016/j.eCoInf.2015.11.004 |
| [39] |
Mischke U, Venohr M, Behrendt H. Using phytoplankton to assess the trophic status of German rivers. International Review of Hydrobiology, 2011, 96(5): 578-598. DOI:10.1002/iroh.201111304 |
| [40] |
Wang X, Zheng BH, Liu LS et al. Water quality evaluation of Dongting Lake based on algae integrity index. Proceeding of 2015 annual academic meeting of Chinese society of Environmental Sciences(Volume Ⅰ), 2015: 1577-1584. [汪星, 郑丙辉, 刘录三等. 基于藻类完整性指数的洞庭湖水质评价. 2015年中国环境科学学会学术年会论文集(第一卷), 2015: 1577-1584. ]
|
| [41] |
Wu J, Jin WL, Chen KL. Analysis of eutrophication characteristics and its main control factors of Lake Yangcheng. Environmental Protection Science, 2021, 47(2): 86-91. [武瑾, 金文龙, 陈亢利. 阳澄湖水体富营养化特征及其主控因子分析. 环境保护科学, 2021, 47(2): 86-91.] |
| [42] |
Li JP, Dong SK, Liu SL et al. Effects of cascading hydropower dams on the composition, biomass and biological integrity of phytoplankton assemblages in the middle Lancang-Mekong River. Ecological Engineering, 2013, 60: 316-324. DOI:10.1016/j.ecoleng.2013.07.029 |
| [43] |
Zhang YY, Ban X, Li EH et al. Evaluating ecological health in the middle-lower reaches of the Hanjiang River with cascade reservoirs using the Planktonic index of biotic integrity (P-IBI). Ecological Indicators, 2020, 114: 106282. DOI:10.1016/j.ecolind.2020.106282 |
| [44] |
Shen ZR, Bian XH, Zhao Y et al. Taiping Lake in Xuyuan Park, Nanjing: Eutrophication, treatment & prevention. J Lake Sci, 1997, 9(4): 377-380. [沈治蕊, 卞小红, 赵燕等. 南京煦园太平湖富营养化及其防治. 湖泊科学, 1997, 9(4): 377-380. DOI:10.18307/1997.0415] |
| [45] |
Zhan YT, Yang CS, Fan ZN et al. Study on interralation between distribution of phytoplankton and water pollution in Fuxi River. China Environmental Science, 1991, 11(1): 29-33. [詹玉涛, 杨昌述, 范正年. 釜溪河浮游植物分布及其水质污染的相关性研究. 中国环境科学, 1991, 11(1): 29-33.] |
| [46] |
Zhang X, Yi QT, Xie K et al. Nutrient kinetics of dominant species of phytoplankton in the artificial lakes formed from land subsidence by mining activities in the Huainan coalmine subsidence areas. J Lake Sci, 2018, 30(3): 713-722. [张鑫, 易齐涛, 谢凯等. 淮南采煤塌陷湖泊浮游植物优势种的营养动力学. 湖泊科学, 2018, 30(3): 713-722. DOI:10.18307/2018.0313] |
| [47] |
Liu XH, Zhao XX, Gao P et al. Annual dynamics of phytoplankton abundance and community structure(2010) in Lake Caizi, Anhui Province. J Lake Sci, 2012, 24(5): 771-779. [刘雪花, 赵秀侠, 高攀等. 安徽菜子湖浮游植物群落结构的周年变化(2010年). 湖泊科学, 2012, 24(5): 771-779. DOI:10.18307/2012.0519] |
| [48] |
Ma BS, Xu B, Wei KJ et al. Phytoplankton community structure and its relation to environmental conditions in the middle Anning River, China. Chinese Journal of Ecology, 2020, 39(10): 3332-3341. [马宝珊, 徐滨, 魏开金等. 安宁河中游浮游植物群落结构及其与环境因子的关系. 生态学杂志, 2020, 39(10): 3332-3341. DOI:10.13292/j.1000-4890.202010.030] |
| [49] |
Dokulil MT, Padisák J. Long-term compositional response of phytoplankton in a shallow, turbid environment, neusiedlersee (Austria/Hungary). Hydrobiologia, 1994, 275/276(1): 125-137. DOI:10.1007/BF00026705 |
| [50] |
Wu ZS, Cai YJ, Liu X et al. Temporal and spatial variability of phytoplankton in Lake Poyang: The largest freshwater lake in China. Journal of Great Lakes Research, 2013, 39(3): 476-483. DOI:10.1016/j.jglr.2013.06.008 |
| [51] |
Wang YL, Yao HL, Wu NW et al. Phytoplankton and organic-detritus in high-output fish ponds with black carp as the major cultured species. Journal of Fisheries of China, 1994, 18(4): 297-304. [王友亮, 姚宏禄, 吴乃薇等. 主养青鱼高产池塘的浮游植物和有机碎屑. 水产学报, 1994, 18(4): 297-304.] |
| [52] |
Ma CX, Yu HX. Phytoplankton community structure in reservoirs of different trophic status, Northeast China. Chinese Journal of Oceanology and Limnology, 2013, 31(3): 471-481. DOI:10.1007/s00343-013-1264-6 |
| [53] |
Li B, Yang GS, Wan RR. Progress on evaluation methods of lake ecosystem health. Advances in Science and Technology of Water Resources, 2014, 34(6): 98-106. [李冰, 杨桂山, 万荣荣. 湖泊生态系统健康评价方法研究进展. 水利水电科技进展, 2014, 34(6): 98-106.] |
| [54] |
Riato L, Leira M, Della BV et al. Development of a diatom-based multimetric index for acid mine drainage impacted depressional wetlands. Science of the Total Environment, 2018, 612: 214-222. DOI:10.1016/j.scitotenv.2017.08.181 |
| [55] |
Gu YR, Xue QJ, Wan X et al. Aquatic ecosystem state evaluation based on P-IBI factor analysis in Songya Lake after ecological restoration. Chinese Journal of Applied and Environmental Biology, 2020, 26(6): 1325-1334. [顾毓蓉, 薛庆举, 万翔等. 基于P-IBI因子分析法评价生态修复后松雅湖水生态状况. 应用与环境生物学报, 2020, 26(6): 1325-1334.] |
| [56] |
Li MM, Luo X, Fu JX et al. Study on phytoplanktonic index of biotic integrity (P-IBI) assessment for marine ecosystem health: A case of beibu gulf. Environmental Monitoring in China, 2018, 34(6): 113-121. [黎明民, 骆鑫, 付家想等. 基于浮游植物生物完整性的北部湾生态健康评价. 中国环境监测, 2018, 34(6): 113-121.] |
| [57] |
Hu J, Shen Q, Chen MX et al. Phytoplankton index of biotic integrity based on factor analysis for water source assessment. Acta Ecologica Sinica, 2019, 39(10): 3759-3769. [胡俊, 沈强, 陈明秀等. 基于因子分析的南湾水库水源地浮游植物生物完整性评价. 生态学报, 2019, 39(10): 3759-3769.] |
| [58] |
Cheng S, Zuo XY, Li TQ et al. Health assessment of Xiaojiang River in Three Gorges Reservoir area based on phytoplankton index of biotic. Express Water Resources & Hydropower Information, 2021, 42(2): 54-60. [程帅, 左新宇, 李同庆等. 基于浮游植物完整性指数的三峡库区小江河流健康评价. 水利水电快报, 2021, 42(2): 54-60.] |
| [59] |
Li Q, Zhang JH, Lin LY et al. Review on methods of water environmental quality assessment. Modern Agricultural Science and Technology, 2011(19): 285-287, 290. [李茜, 张建辉, 林兰钰等. 水环境质量评价方法综述. 现代农业科技, 2011(19): 285-287, 290.] |
 2022, Vol. 34

