(2: 西北农林科技大学水利与建筑工程学院, 杨凌 712100)
(2: Key Laboratory for Agricultural Soil and Water Engineering in Arid and Semiarid Area of Ministry of Education, Northwest A&F University, Yangling 712100, P.R. China)
中国西北内陆干旱区位于欧亚大陆腹地,气候干旱少雨,水资源短缺问题严重,生态环境敏感脆弱[1]。威胁着区域可持续发展,已引起我国政府的高度重视[2]。自1999年起,国家实施退耕还林政策,西北地区生态状况得到一定程度的恢复[3]。但是,生态植被恢复也会增加植被需水,盲目地恢复生态植被可能会加剧区域水资源短缺,进而影响植被生长,形成恶性循环[4]。生态需水是水资源合理配置与生态环境建设的重要依据[5],开展内陆河流域植被生态需水量研究对维持区域生态健康与可持续发展具有重要意义。
1990s以来,随着国际水文计划(IHP)、世界气候研究计划(WCRP)等一系列国际水科学计划的实施,从河流水域向陆地生态植被,生态需水研究范围不断扩大[6];从城市生态需水[7]到湿地[8]、森林[9]、草原[10]和沙漠生态需水[11],生态需水的分类不断细致;从水热平衡、水盐平衡、水沙平衡到源汇项平衡和生物平衡,研究的基础理论不断完善[12]。西北地区受人类活动和气候因素双重影响,水资源供需矛盾突出,导致生产用水挤占生态需水,生态环境稳定性较差,因此国内植被生态需水研究多集中于这些地区[13-14]。形成了直接计算法、改进的Penman-Monteith(以下简称PM)法、潜水蒸发法、水量平衡法、基于3S技术的方法等多种评估方法[15]。其中,直接计算法[16]理论依据充分,但对参数要求较高,适用于基础资料较为全面的地区;潜水蒸发法[17]适用于降水稀少、植被生长主要依赖地下水的干旱地区,但需要大量实验数据支撑,工作量大;水量平衡法[18]适用于研究闭合流域或河段输入量、输出量与存储量之间的水量平衡关系,但计算结果为生态用水,未能体现生态系统实际需求;改进的PM法[19-20]用充分供水条件下的植被潜在蒸腾量代替植被需水,适用于水分条件充足的地区;基于3S技术的方法[21-22]可为大尺度区域提供地表气象、水文、生态等信息,但不能体现需水的动态变化。以上方法多从气象要素或下垫面条件出发,未考虑生态系统的自我调节能力,即生态系统恢复力。
1973年,Holling[23]将恢复力概念引入生态学领域,应用于引导受人类活动影响而退化的生态系统的恢复。此后国内外学者就生态系统恢复力的概念、内涵、研究方法和研究尺度等进行了大量探索[24-27]。生态恢复力是指生态系统在外界扰动下仍能保持自身结构和功能稳定的能力[28],与系统内外的参数和变量密切相关。Hao等[29]首次将生态系统恢复理论引入生态需水研究中,评估了塔里木河各类植被的年生态需水阈值,但忽略了生态需水的年内分配以及生长期的水分盈亏状况。针对以上问题,本研究采用生态系统恢复力法评估石羊河流域中下游植被生长季的生态需水,并与基于改进PM公式的土壤水分特征值法进行对比,分析不同类型植被生长期生态需水与有效降水之间的水分盈亏关系。本研究可为干旱内陆河流域的水资源合理配置与高效利用和生态建设提供科学参考。
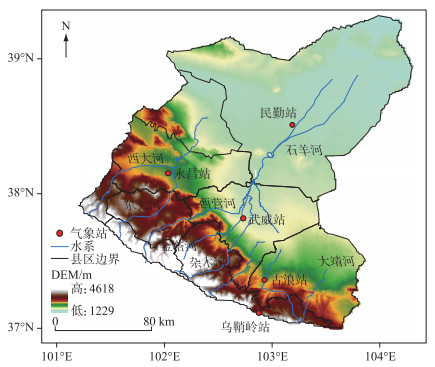
1 研究区概况与数据来源 1.1 研究区概况石羊河流域(36°29′~39°27′N,101°41′~104°16′E)位于甘肃省河西走廊东部,是河西走廊三大内陆河流域之一(图 1)。受地形阻挡的影响,流域上游祁连山区降水丰富,是石羊河的发源地,也是重要的水源涵养区,植被覆盖率高;中下游降水稀少,蒸发强烈,属于典型的资源型缺水地区[30]。石羊河流域是我国内陆河流域中人口最密集、水资源开发利用程度最高、生态环境问题最严重的流域之一[31]。受到气候变化和人类活动的双重影响,流域中下游水资源日益短缺,生态用水难以保障,面临严重的生态危机。2007年实施了《石羊河流域重点治理规划》,通过上游涵养水源、中游管理调度、下游节水恢复等一系列措施,流域生态环境得以明显改善。尽管有关该流域的生态需水研究已有一些成果,但从生态系统恢复力视角评估生态需水的研究文献未见报道。
|
图 1 石羊河流域概况 Fig.1 Overview of Shiyang River Basin |
本研究采用国家气象科学数据中心提供的石羊河流域1982-2020年永昌、武威、民勤、乌鞘岭和古浪5个气象站的逐日气象数据,通过反距离权重法进行空间插值,得到空间分辨率为1 km×1 km的网格化气象数据;土地利用数据来源于中国科学院资源环境数据中心中国1980-2020年土地利用遥感监测数据集(CNLUCC)[32],时间间隔为5年,空间分辨率为1 km×1 km。根据分类标准,将研究区植被分为高覆盖度草地、中覆盖度草地、低覆盖度草地、有林地、灌木林、疏林地和其他林地共七类。其中高覆盖度草地指覆盖度>50% 的天然草地、改良草地和割草地,中覆盖度草地为覆盖度在20% ~50% 的天然草地和改良草地,低覆盖度草地为覆盖度在5% ~20% 的天然草地;植被指数数据为GIMMS和MODIS提供的NDVI,时间范围分别为1982-2015和2001-2020年,空间分辨率分别为8 km×8 km和1 km×1 km,在此将GIMMS NDVI基于最邻近分配法重采样至1 km×1 km,结合2001-2015年的重叠数据计算尺度因子,展延得到MODIS NDVI 1982-2020年的1 km×1 km的逐月NDVI数据;土壤质地数据(图 2)来源于中国科学院资源环境数据中心(https://www.resdc.cn/)土壤质地空间分布数据,该数据根据1 ∶1000000土壤类型图和第二次土壤普查获取到的土壤剖面数据编制而成。

|
图 2 土壤质地和NDVI空间分布 Fig.2 Spatial distribution of soil texture and NDVI |
通常植被生态需水的定义是从植被生态的角度出发,指在其他因素不受限制的条件下,维持植被正常生长所需要的水量,其计算依赖于农业气象学中的植被蒸散理论[9]。而植被生态系统时刻处于吸收干扰-重组的弹性变化中[33],这种植被生态系统所具有的自我调节能力,即生态系统恢复力。根据生态系统恢复力理论,将植被生态需水阈值定义为生态系统维持自我调节能力所能够改变的最大幅度的需水阈值,低于生态需水阈值后,现有的生态平衡将遭到破坏。因此植被生态需水为最小至适宜的弹性区间,最小生态需水和适宜生态需水分别为保证植被基本生存和正常生长的生态需水量。
2.2 生态需水阈值的确定 2.2.1 土壤水分特征值法(CVSW)闵庆文等[34]提出,植被暂时凋萎含水量(St)和生长阻滞含水量(Sr)分别是能保证林木基本生存和正常生长时的土壤含水量下限,因此将土壤水量在此2种情况下时的生态需水量分别作为最小生态需水定额和适宜生态需水定额。生态需水定额由改进的PM公式[35]计算:
| $ E T_{\mathrm{c}}=K_{\mathrm{s}} \times E T_0 \times K_{\mathrm{c}} $ | (1) |
式中, ETc为非标准条件作物蒸散发量(mm/d);Ks为水分胁迫系数(无量纲);ET0为参照作物蒸散发量(mm/d);Kc为植被系数(无量纲)。
采用FAO-56推荐的PM公式计算参照作物蒸散发量ET0,即:
| $ E T_0=\frac{0.408 \Delta\left(R_{\mathrm{n}}-G\right)+\gamma \frac{900}{T+273} u_2\left(e_{\mathrm{s}}-e_{\mathrm{a}}\right)}{\Delta+\gamma\left(1+0.34 u_2\right)} $ | (2) |
式中, Rn为作物表面上的净辐射(MJ/(m2 ·d));G为土壤热通量(MJ/(m2 ·d));T为2 m高处日平均气温(℃);u2为2 m高处的风速(m/s);es为饱和水汽压(kPa);ea为实际水汽压(kPa);es-ea为饱和水汽压差(kPa);Δ为饱和水汽压的倾率;γ为湿度计常数(kPa/℃)。
Ks计算公式[36]为:
| $ K_{\mathrm{s}}=\left\{\begin{array}{c} 1, \theta>\theta_{\mathrm{c}} \\ \frac{\theta-\theta_{\mathrm{z}}}{\theta_{\mathrm{c}}-\theta_{\mathrm{z}}}, \theta_{\mathrm{z}} \leqslant \theta \leqslant \theta_{\mathrm{c}} \\ 0, \theta <\theta_{\mathrm{z}} \end{array}\right. $ | (3) |
式中,θ为土壤实际含水量(mm),可基于土壤质地百分比分布图,结合李卓等[37]对土水势的研究成果,采用Saxton等[38]提出的方法计算;θc为土壤临界含水量(mm),约为田间持水量的70% ~80%,本研究取值为75%;θz为土壤凋萎系数含水量(mm)。
Choudhury等[39]研究表明,对于干旱区干燥的土壤,可用植被蒸腾系数Tc替代植被系数Kc:
| $ K_{\mathrm{c}}=T_{\mathrm{c}}=\left(\frac{N D V I-N D V I_{\min }}{N D V I_{\max }-N D V I_{\min }}\right)^\eta $ | (4) |
式中, NDVImax和NDVImin分别为不同类型植被各月对应的最小和最大NDVI值;Groeneveld等[40]的研究结果表明,η可取近似值为1。
2.2.2 生态系统恢复力法(LER)生态系统恢复力法(latitude of ecosystem resilience, LER)是Hao等[29]提出的年生态需水阈值计算方法,即引入生态系统恢复力范围LAT(latitude)指标,该指标可理解为系统在失去自主恢复能力之前可以改变的最大数量[41]。本研究将该思路引入到月尺度的生态需水阈值计算中,并依据NDVI序列的突变点数,评估恢复力。具体计算步骤为:①采用Mann-Kendall法识别流域中下游年NDVI序列变化趋势与突变点数(m),确定年NDVI序列的稳定阶段数n(n=m+1),并按式(5)计算不同植被类型稳态下的LAT;②由张阳阳等[42]对西北地区典型植被地下水埋深统计分析和郭占荣[43]的土壤水量与地下水埋深经验公式,应用式(3)可分别得出适宜需水和最小需水条件下的Ks,而后按式(1)计算ET,并由式(6)计算ET相对于NDVI的弹性系数εNDVI_ET;③根据εNDVI_ET和LAT按式(7)计算ΔET,按式(8)和(9)分别计算不同植被月最小和适宜生态需水阈值。计算公式为:
| $ L A T=\frac{1}{n} \sum \max \left|\left(N D V I_{\mathrm{n} i}-\overline{N D V I_{\mathrm{n}}}\right) / \overline{N D V I_{\mathrm{n}}}\right| $ | (5) |
| $ \varepsilon_{\text {NDVI_ET }}=\operatorname{median}\left[\frac{\left(E T_i-\overline{E T}\right) / \overline{E T}}{\left(N D V I_i-\overline{N D V I}\right) / \overline{N D V I}}\right] $ | (6) |
| $ \Delta E T=\varepsilon_{\text {NDVI_ET }} \times L A T $ | (7) |
| $ E T_{\text {cmin }}=\overline{E T_{\mathrm{c}}}-\Delta E T $ | (8) |
| $ E T_{\text {copt }}=\overline{E T_{\mathrm{c}}}+\Delta E T $ | (9) |
式中,εNDVI_ET为弹性系数(无量纲);ETcmin和ETcopt分别为最小和适宜生态需水量(mm);ΔET为生态需水弹性变化量(mm)。
2.3 有效降水量有效降水量是指渗入土壤并储存在作物主要根系吸水层中的降水量,其值与根系吸水层的深度、土壤持水能力、雨前土壤持水量、降水强度和降水量等因素有关。美国农业部土壤保持局推出根据实测日降水量推算日有效降水量的方法[44],且已被证实在我国西北地区具有良好的适用性[45-47]。计算公式为:
| $ \left\{\begin{array}{c} P_{\mathrm{eff}}=\frac{p(4.17-0.2 p)}{4.17}, p <8.3 \\ P_{\mathrm{eff}}=4.17+0.1 p, p \geq 8.3 \end{array}\right. $ | (10) |
式中,Peff为日有效降水量(mm/d);p为实测日降水量(mm/d)。
2.4 水分盈亏指数植被逐月生态水分盈亏量计算公式[48]为:
| $ H_i=E T_{\mathrm{c} i}-P_{\mathrm{eff}i} $ | (11) |
式中,Hi为植被第i月的生态水分盈亏量(mm);ETci和Peffi分别为第i月的生态需水定额和有效降水量(mm)。
应用水分盈亏指数反映植被生长期内水分盈亏状况,计算公式[49]为:
| $ I=\left(P_{\text {eff }}-E T_{\mathrm{c}}\right) / E T_{\mathrm{c}} $ | (12) |
式中,I为水分盈亏指数。I>0、I=0、I<0分别表示植被生长期水分盈余、供需平衡和水分亏缺。
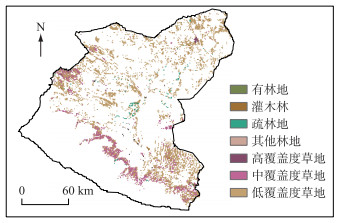
3 结果与分析 3.1 石羊河流域中下游植被时空分布特征石羊河流域中下游2020年的植被空间分布如图 3所示。由图可知,流域中下游林地较稀疏,多分布于河流、水库沿岸;草地覆盖面积远大于林地,但高覆盖度草地分布范围较小,中覆盖度草地多分布于流域中游,下游总体为荒漠植被景观。1980-2020年流域中下游的各植被类型面积的时间变化情况见表 1。由于低覆盖度草地大多位于中下游巴丹吉林沙漠和腾格里沙漠区,基本呈现荒漠植被景观,因此不将其纳入生态需水研究范畴。从表 1可知,流域中下游植被面积总体呈增加趋势,变化速率为2.60 km2/5 a,其中高覆盖度草地和中覆盖度草地面积增长较为显著,变化速率分别为1.91和1.82 km2/5 a;林地面积总体呈减少趋势,线性倾向率为-1.13 km2/5 a,其中疏林地和灌木林面积呈现减少趋势,变化速率分别为-1.42和-0.63 km2/5 a,而有林地和其他林地面积呈微弱增加趋势,变化速率分别为0.20和0.72 km2/5 a。
|
图 3 2020年石羊河流域中下游植被分布 Fig.3 Vegetation distribution of the middle and lower reaches of the Shiyang River Basin in 2020 |
| 表 1 石羊河流域中下游植被面积及变化趋势(km2) Tab. 1 Vegetation area and change in the middle and lower reaches of the Shiyang River Basin |
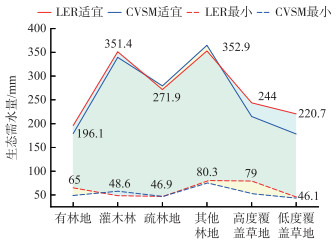
基于CVSW和LER两种方法得到的流域中下游植被适宜和最小生态需水定额分别如表 2和表 3所示。两种方法计算结果接近,需水量年内分配规律及数据范围等与前人结论[50-51]一致,可知LER法适用于研究区的生态需水阈值计算。除疏林地和其他林地外,LER法的生态需水阈值变化区间大于CVSW(图 4)。更稳定的生态系统能在受到干扰后更快地恢复到初始状态[52-54],应具有更大的阈值区间,表明LER具有更强的稳定性。稳定性排序为中覆盖度草地>有林地>高覆盖度草地>疏林地>灌木林>其他林地。不同类型植被生态需水定额总体符合夏季多、春秋少的规律,6-8月生态需水约占生长期总需水的50%;灌木林和其他林地的适宜生态需水定额最大,其次分别为疏林地、高覆盖度草地、中覆盖度草地和有林地;其他林地的最小生态需水定额最大,其次为高覆盖度草地、有林地、灌木林、中覆盖度草地和疏林地。
| 表 2 石羊河流域中下游植被生长期适宜生态需水定额(mm) Tab. 2 Suitable ecological water demand quota for vegetation growth period in the middle and lower reaches of the Shiyang River Basin |
| 表 3 石羊河流域中下游植被生长期最小生态需水定额(mm) Tab. 3 Minimum ecological water demand quota for vegetation growth period in the middle and lower reaches of the Shiyang River Basin |
|
图 4 生态需水阈值区间图 Fig.4 The range of ecological water demand threshold |
天然降水及植被生态需水在年内分布具有一定的差异性,表 4和表 5分别为不同植被适宜需水条件与最小需水条件的生长期逐月水分盈亏情况。
| 表 4 不同植被适宜需水条件逐月盈亏水量与水分盈亏指数 Tab. 4 The yield and loss water volume quota and water yield and loss index of different vegetation in growth period |
| 表 5 不同植被最小需水条件逐月盈亏水量与水分盈亏指数 Tab. 5 The yield and loss water volume quota and water yield and loss index of different vegetation in growth period |
适宜需水条件下,各植被生长期总体处于缺水状态,灌木林缺水最严重,水分亏缺指数达59.1%;缺水严重程度排序为灌木林>其他林地>疏林地>高覆盖度草地>中覆盖度草地>有林地。同一植被亏缺水量基本符合春秋多、夏季少的规律。夏季(6-8月)植被进入稳定生长期,生态需水量相较春季不再增加,且降水较为丰沛,缺水状况得到缓解,有林地和中覆盖度草地在8月出现水分盈余;进入秋季后,植被进入生长末期,虽然需水量减少,但降水量也相应减少,依然整体表现为缺水现象。
最小需水条件下,只有其他林地存在生长期缺水,表明研究区天然水分状况可以满足植被基本生存需求。植被生长期内,有林地、灌木林和高覆盖度草地仅在4月出现轻微缺水;疏林地和中覆盖度草地不缺水;而其他林地处于持续缺水状态,仅在9月和10月后植被进入生长末期,生态需水量减少,才出现水分盈余现象。植被在4月的缺水状况与春季是植被的快速生长发育期有关,受到土壤解冻的影响,土壤含水率增加,引起植被快速生长,进而导致生态需水量上升,但降水没有显著增加,因而出现春季缺水。
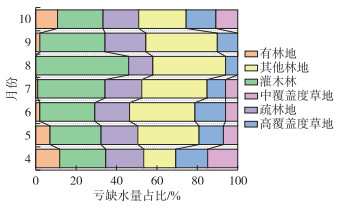
图 5反映了适宜需水条件下,各植被生长期内逐月亏缺水量占总亏缺水量比例。同一类型植被在生长期内不同月份亏缺水量占比较为一致,林地生态缺水量总体占比较大,4-10月分别为69%、71%、79%、85%、94%、90% 和74%,表明林地的单位面积缺水状况较为严重。
|
图 5 适宜条件下植被生长期逐月亏缺水量占比 Fig.5 Proportion of monthly water deficit during vegetation growth period under suitable conditions |
表 6和表 7分别为石羊河流域中下游适宜需水和最小需水条件下不同类型植被的生态需水量和生态缺水量。适宜生态需水量由大到小依次为中覆盖度草地、疏林地、灌木林、高覆盖度草地、其他林地、有林地。全部植被总适宜生态需水量为3.7×10⁸ m3。由于中覆盖度草地植被覆盖面积远大于其他类型植被,因而中覆盖度草地生态需水量最大。在适宜需水条件下,植被生长期均处于水分亏缺状态,不同植被类型的亏缺水量由大到小依次为中覆盖度草地、疏林地、灌木林、高覆盖度草地、其他林地、有林地。全部植被生长期总亏缺水量为1.2×10⁸ m3。
| 表 6 适宜条件下各类型植被生态需水量和生态缺水量(×104 m3) Tab. 6 Suitable ecological water demand and ecological water deficit of different types of vegetation |
| 表 7 最小条件下各类型植被生态需水量和生态缺水量(×104 m3) Tab. 7 Minimum ecological water demand and ecological water deficit of different types of vegetation |
不同植被最小生态需水量由大到小依次为中覆盖度草地、疏林地、高覆盖度草地、灌木林、其他林地、有林地。全部植被生长期总最小生态需水量为7977.6×104 m3。在最小需水条件下,除其他林地外的植被均处于水分盈余状态,表明天然降水基本可以满足研究区植被的基本生存需求,但其他林地需进行人工灌溉或发展其他植被。根据土地利用遥感监测数据集分类标准,其他林地主要指未成林造林地和苗圃、果园等人工林地,且主要分布于研究区内红水河、金川河和石羊河沿岸,可采取修筑引水渠等手段进行人工补水。若不补水,可能导致该地区生态系统稳定性、连通性、多样性的降低,最终导致生态退化和经济社会损失。
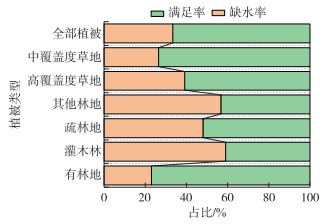
图 6反映了不同植被类型生态缺水量与生态需水满足量占比状况。其他林地和灌木林亏缺水量占比最大,均高于50%,表明该2种植被生态缺水状况较为严重;有林地缺水量占比最小,其次为中覆盖度草地。综合单位面积水分盈亏指数和生态缺水量,可知有林地和中覆盖度草地缺水程度较轻,适宜于石羊河流域中下游气候,可进行适当发展。
|
图 6 适宜条件下不同类型植被生态缺水量与满足量占比 Fig.6 The proportion of ecological water shortage and satisfaction of different types of vegetation |
本文采用基于LER方法计算了石羊河流域中下游植被1982-2020年生态需水阈值和生态缺水量,并将结果与基于CVSW以及前人研究成果进行比较,对不同植被年内生长期及逐月水分盈亏平衡关系进行分析。研究表明:
1) 基于LER和CVSW的两种生态需水计算方法结果相近,而基于LER的方法更适用于缺少土壤水分观测资料的干旱地区。
2) 天然降水基本可以满足石羊河流域植被的基本生存,但无法满足正常生长需求。在适宜生态需水条件下,流域中下游植被整体处于水分亏缺状态,亏缺严重程度从大到小依次为灌木林、其他林地、疏林地、高覆盖度草地、中覆盖度草地、有林地。植被快速生长期水分亏缺状态最为严重,夏季水分亏缺状态有所缓解;在最小生态需水条件下,生长期逐月生态需水基本能够得以满足。
| [1] |
Su XL, Chu JD, Zhang T et al. Spatio-temporal evolution trend of groundwater drought and its dynamic response to meteorological drought in Northwest China. Water Resources Protection, 2022, 38(1): 34-42. [粟晓玲, 褚江东, 张特等. 西北地区地下水干旱时空演变趋势及对气象干旱的动态响应. 水资源保护, 2022, 38(1): 34-42. DOI:10.3880/j.issn.10046933.2022.01.005] |
| [2] |
Zhao XJ, Wang J, Su JD et al. Assessment of habitat quality and degradation degree based on InVEST model and Moran index in Gansu Province, China. Transactions of the Chinese Society of Agricultural Engineering, 2020, 36(18): 301-308. [赵晓冏, 王建, 苏军德等. 基于InVEST模型和莫兰指数的甘肃省生境质量与退化度评估. 农业工程学报, 2020, 36(18): 301-308. DOI:10.11975/j.issn.1002-6819.2020.18.035] |
| [3] |
Meng XJ, Chang JX, Wang XB et al. Multi-objective hydropower station operation using an improved cuckoo search algorithm. Energy, 2019, 168: 425-439. DOI:10.1016/j.energy.2018.11.096 |
| [4] |
Li LQ, Wang ZZ, He HX et al. Research of water resources multi-dimensional equilibrium allocation based on eco-hydrological threshold regulation in inland arid region. Journal of Hydraulic Engineering, 2019, 50(3): 377-387. [李丽琴, 王志璋, 贺华翔等. 基于生态水文阈值调控的内陆干旱区水资源多维均衡配置研究. 水利学报, 2019, 50(3): 377-387.] |
| [5] |
Su XL, Liu YH, Jiang TL et al. Prediction of future ecological water demand of terrestrial ecosystem in northwest China. Water Resources Protection, 2022, 1-14. [粟晓玲, 刘雨翰, 姜田亮等. 西北地区陆地生态系统未来生态需水量预估. 水资源保护, 2022, 1-14.] |
| [6] |
Zhang LM, Alpert P, Yu FH. Nutrient foraging ability promotes intraspecific competitiveness in the clonal plant Hydrocotyle vulgaris. Ecological Indicators, 2022, 138: 108862. DOI:10.1016/j.ecolind.2022.108862 |
| [7] |
Jia HF, Ma HT, Wei MJ. Calculation of the minimum ecological water requirement of an urban river system and its deployment: A case study in Beijing central region. Ecological Modelling, 2011, 222(17): 3271-3276. DOI:10.1016/j.ecolmodel.2011.05.026 |
| [8] |
Bai JH, Guan YN, Liu PP et al. Assessing the safe operating space of aquatic macrophyte biomass to control the terrestrialization of a grass-type shallow lake in China. Journal of Environmental Management, 2020, 266: 110479. DOI:10.1016/j.jenvman.2020.110479 |
| [9] |
He YT, Min QW, Li WH. Progress and perspectives on ecological water requirement of vegetation. Resources Science, 2005, 27(4): 8-13. [何永涛, 闵庆文, 李文华. 植被生态需水研究进展及展望. 资源科学, 2005, 27(4): 8-13. DOI:10.1360/biodiv.050058] |
| [10] |
Wang D, Zhang SH, Wang GL et al. Ecohydrological variation and multi-objective ecological water demand of the Irtysh River Basin. Water, 2022, 14(18): 2876. DOI:10.3390/w14182876 |
| [11] |
Ling HB, Guo B, Xu HL et al. Configuration of water resources for a typical river basin in an arid region of China based on the ecological water requirements (EWRs) of desert riparian vegetation. Global and Planetary Change, 2014, 122: 292-304. DOI:10.1016/j.gloplacha.2014.09.008 |
| [12] |
Gao F, Huang Q, Chang JX. Processs and perspectives of ecological water requirement in China. Resources and Environment in the Yangtze Basin, 2011, 20(6): 755-760. [高凡, 黄强, 畅建霞. 我国生态需水研究现状、面临挑战与未来展望. 长江流域资源与环境, 2011, 20(6): 755-760.] |
| [13] |
Jia BQ, Xu YQ. The conception of the eco-environmental water demand and its classification in arid land-taking Xinjiang as an example. Arid Land Geography, 1998, 21(2): 8-12. [贾宝全, 许英勤. 干旱区生态用水的概念和分类——以新疆为例. 干旱区地理, 1998, 21(2): 8-12.] |
| [14] |
Hu GL, Zhao WZ, Xie GX. Advances on theories of ecological water requirements of vegetation in arid area. Advances in Earth Science, 2008, 23(2): 193-200. [胡广录, 赵文智, 谢国勋. 干旱区植被生态需水理论研究进展. 地球科学进展, 2008, 23(2): 193-200. DOI:10.3321/j.issn:1001-8166.2008.02.010] |
| [15] |
刘娇. 基于3S技术的黑河流域植被生态需水量研究[学位论文]. 杨凌: 西北农林科技大学, 2014.
|
| [16] |
Yang AM, Tang KW, Wang H et al. Theory and calculation method of ecological water use. Journal of Hydraulic Engineering, 2004, 35(12): 39-45. [杨爱民, 唐克旺, 王浩等. 生态用水的基本理论与计算方法. 水利学报, 2004, 35(12): 39-45.] |
| [17] |
Zhang RJ, Duan ZH, Tan ML et al. Evaluation and prediction of ecological water requirement of natural vegetation in Shiyang river basin. Journal of Desert Research, 2012, 32(2): 545-550. [张瑞君, 段争虎, 谭明亮等. 石羊河流域天然植被生态需水量估算及预测. 中国沙漠, 2012, 32(2): 545-550.] |
| [18] |
Yang LB, Huang Q, Ruan BQ et al. Study on ecological water requirement of Ejina Oasis. Journal of Hydraulic Engineering, 2012, 43(9): 1127-1133. [杨立彬, 黄强, 阮本清等. 额济纳绿洲生态需水研究. 水利学报, 2012, 43(9): 1127-1133.] |
| [19] |
Song XY, Liu Y, Qin L et al. Ecological water requirement of natural grassland vegetation in the Otog Banner of Inner Monglia. Transactions of the Chinese Society of Agricultural Engineering, 2021, 37(3): 107-115. [宋孝玉, 刘雨, 覃琳等. 内蒙古鄂托克旗天然草地植被生态需水量研究. 农业工程学报, 2021, 37(3): 107-115.] |
| [20] |
He YT, Min QW, Li WH et al. Calculation of ecological water requirement of forests in Jinghe watershed. Journal of Soil Water Conservation, 2004, 18(6): 152-155. [何永涛, 闵庆文, 李文华等. 森林植被生态需水量的确定和计算——以泾河流域为例. 水土保持学报, 2004, 18(6): 152-155.] |
| [21] |
Wang LX, Ren ZX, Ren ZY et al. Evaluation to ecological water requirement of dry land system based on ecological function zones in Yanhe watershed. Transactions of the Chinese Society of Agricultural Engineering, 2012, 28(6): 156-161. [王丽霞, 任朝霞, 任志远等. 基于生态功能分区的陕北延河流域旱地系统生态需水测评. 农业工程学报, 2012, 28(6): 156-161. DOI:10.3969/j.issn.1002-6819.2012.06.026] |
| [22] |
Wang F, Liang RJ, Yang XL et al. A study of ecological water requirements in northwest China I: Theoretical analysis. Journal of Natural Resources, 2002, 17(1): 1-8. [王芳, 梁瑞驹, 杨小柳等. 中国西北地区生态需水研究(1)——干旱半干旱地区生态需水理论分析. 自然资源学报, 2002, 17(1): 1-8.] |
| [23] |
Holling CS. Resilience and stability of ecological systems. Annual Review of Ecology and Systematics, 1973, 4: 1-23. DOI:10.1146/annurev.es.04.110173.000245 |
| [24] |
Dakos V, Kéfi S. Ecological resilience: What to measure and how. Environmental Research Letters, 2022, 17(4): 043003. DOI:10.1088/1748-9326/ac5767 |
| [25] |
Rotarangi SJ, Stephenson J. Resilience Pivots: Stability and Identity in a Social-Ecological-Cultural System. Ecology and Society, 2014, 19(1): 28. DOI:10.5751/es-06262-190128 |
| [26] |
Chen JJ, Chi YG, Zhou W et al. Quantifying the dimensionalities and drivers of ecosystem stability at global scale. Journal of Geophysical Research: Biogeosciences, 2021, 126(4). DOI:10.1029/2020jg006041 |
| [27] |
Clark AT, Arnoldi JF, Zelnik YR et al. General statistical scaling laws for stability in ecological systems. Ecology Letters, 2021, 24(7): 1474-1486. DOI:10.1111/ele.13760 |
| [28] |
Yuan Y, Bai ZK. Research progress of ecosystem resilience based on bibliometric investigation. Transactions of the Chinese Society of Agricultural Engineering, 2020, 36(3): 271-278. [袁媛, 白中科. 基于文献计量分析的生态系统恢复力研究进展. 农业工程学报, 2020, 36(3): 271-278. DOI:10.11975/j.issn.1002-6819.2020.03.033] |
| [29] |
Hao XM, Zhao ZY, Fan X et al. Evaluation method of ecological water demand threshold of natural vegetation in arid-region inland river basin based on satellite data. Ecological Indicators, 2023, 146: 109811. DOI:10.1016/j.ecolind.2022.109811 |
| [30] |
Zhao XY, Liu CF, Wang XL et al. Assessment of the vulnerability of farmers' livelihoods to ecological degradation in arid regions of a continental river basin: A case study of the middle-lower reaches of the Shiyang River in China. Acta Ecologica Sinica, 2016, 36(13): 4141-4151. [赵雪雁, 刘春芳, 王学良等. 干旱区内陆河流域农户生计对生态退化的脆弱性评价——以石羊河中下游为例. 生态学报, 2016, 36(13): 4141-4151. DOI:10.5846/stxb201506201250] |
| [31] |
粟晓玲. 石羊河流域面向生态的水资源合理配置理论与模型研究[学位论文]. 杨凌: 西北农林科技大学, 2007.
|
| [32] |
徐新良, 刘纪远, 张树文等. 中国多时期土地利用遥感监测数据集(CNLUCC). 资源环境科学数据注册与出版系统(http://www.resdc.cn/DOI). 2018.
|
| [33] |
Fan XE, Hao XM, Hao HC et al. Comprehensive assessment indicator of ecosystem resilience in central Asia. Water, 2021, 13(2): 124. DOI:10.3390/w13020124 |
| [34] |
Min QW, He YT, Li WH et al. Estimation of forests' ecological water requirement based on agrometeorology: Taking Jinghe Watershed as an example. Acta Ecologica Sinica, 2004, 24(10): 2130-2135. [闵庆文, 何永涛, 李文华等. 基于农业气象学原理的林地生态需水量估算——以泾河流域为例. 生态学报, 2004, 24(10): 2130-2135. DOI:10.3321/j.issn:1000-0933.2004.10.006] |
| [35] |
Allen R, Pereira LS, Raes D et al. Crop evapotranspiration: Guidelines for computing crop water requirements. Rome: Food and Agriculture Organization of United Nation, 1998.
|
| [36] |
Zhang L, Zhu ZY, Zhang SW et al. Analysis of soil moisture variation and its influencing factors in semi-arid steppe watershed. Transactions of the Chinese Society of Agricultural Engineering, 2020, 36(13): 124-132. [张璐, 朱仲元, 张圣微等. 半干旱草原型流域土壤水分变异及其影响因素分析. 农业工程学报, 2020, 36(13): 124-132.] |
| [37] |
Li Z, Wu PT, Feng H et al. Simulated experiment on effects of soil bulk density on soil water holding capacity. Acta Pedologica Sinica, 2010, 47(4): 611-620. [李卓, 吴普特, 冯浩等. 容重对土壤水分蓄持能力影响模拟试验研究. 土壤学报, 2010, 47(4): 611-620.] |
| [38] |
Saxton KE, Rawls WJ, Romberger JS et al. Estimating generalized soil-water characteristics from texture. Soil Science Society of America Journal, 1986, 50(4): 1031-1036. DOI:10.2136/sssaj1986.03615995005000040039x |
| [39] |
Choudhury BJ, Ahmed NU, Idso SB et al. Relations between evaporation coefficients and vegetation indices studied by model simulations. Remote Sensing of Environment, 1994, 50(1): 1-17. DOI:10.1016/0034-4257(94)90090-6 |
| [40] |
Groeneveld DP, Baugh WM, Sanderson JS et al. Annual groundwater evapotranspiration mapped from single satellite scenes. Journal of Hydrology, 2007, 344(1): 146-156. DOI:10.1016/j.jhydrol.2007.07.002 |
| [41] |
Hodgson D, McDonald JL, Hosken DJ. What do You mean, 'resilient'?. Trends in Ecology & Evolution, 2015, 30(9): 503-506. DOI:10.1016/j.tree.2015.06.010 |
| [42] |
Zhang YY, Chen X, Gao M et al. Meta-analysis of ecological depth to groundwater table and its influencing factors in aird region of northwest China. South-to-North Water Transfers and Water Science & Technology, 2020, 18(5): 57-65. [张阳阳, 陈喜, 高满等. 基于元数据分析的西北干旱区生态地下水位埋深及其影响因素. 南水北调与水利科技, 2020, 18(5): 57-65.] |
| [43] |
Guo ZR, Liu HT. Eco-depth of groundwater tablefor natural vegetation in inland basin, northwestern China. Journal of Arid Land Resources & Environment, 2005, 19(3): 157-161. [郭占荣, 刘花台. 西北内陆盆地天然植被的地下水生态埋深. 干旱区资源与环境, 2005, 19(3): 157-161. DOI:10.3969/j.issn.1003-7578.2005.03.031] |
| [44] |
Martin S, Land F. Food and Agriculture Organization of the United Nations. CROPWAT: A Computer Program for Irrigation Planning and Management, 1992.
|
| [45] |
Cao XC, Wu PT, Wang YB et al. Analysis on temporal and spatial differences of water productivity in irrigation districts in China. Transactions of the Chinese Society of Agricultural Engineering, 2012, 28(13): 1-7. [操信春, 吴普特, 王玉宝等. 中国灌区水分生产率及其时空差异分析. 农业工程学报, 2012, 28(13): 1-7. DOI:10.3969/j.issn.1002-6819.2012.13.001] |
| [46] |
Zhao Y, Huang KJ, Gao XR et al. Evaluation of grain production water footprint and influence of grain virtual water flow in the Yellow River Basin. Water Resources Protection, 2022, 38(4): 39-47. [赵勇, 黄可静, 高学睿等. 黄河流域粮食生产水足迹及虚拟水流动影响评价. 水资源保护, 2022, 38(4): 39-47. DOI:10.3880/j.issn.1004-6933.2022.04.007] |
| [47] |
Zhang H, Wang H, Xu CG. Spatial and temporal characteristics of water requirement and water deficit of maize in Gansu Province from 1967 to 2017. Acta Ecologica Sinica, 2020, 40(5): 1718-1730. [张华, 王浩, 徐存刚. 1967-2017年甘肃省玉米需水量与缺水量时空分布特征. 生态学报, 2020, 40(5): 1718-1730. DOI:10.5846/stxb201901150125] |
| [48] |
Li JY. Characteristics of vegetation ecological water demand in Yanchi County in the arid area of Central Ningxia. Arid Land Geography, 2018, 41(5): 1064-1072. [李金燕. 宁夏中部干旱带盐池县植被生态需水规律研究. 干旱区地理, 2018, 41(5): 1064-1072.] |
| [49] |
Wei XG, Wang TL, Li B et al. Temporal and spatial distribution characteristics of maize water surplus deficit and irrigation mode partition in Liaoning Province. Transactions of the Chinese Society of Agricultural Engineering, 2018, 34(23): 119-126. [魏新光, 王铁良, 李波等. 辽宁省玉米地水分盈亏时空分布特征及灌溉模式分区研究. 农业工程学报, 2018, 34(23): 119-126. DOI:10.11975/j.issn.1002-6819.2018.23.014] |
| [50] |
Hao B, Su XL, Ma XY. Study on ecological water requirement for natural vegetation in Minqin County of Gansu Province. Journal of Northwest A & F University: Natural Science Edition, 2010, 38(2): 158-164. [郝博, 粟晓玲, 马孝义. 甘肃省民勤县天然植被生态需水研究. 西北农林科技大学学报: 自然科学版, 2010, 38(2): 158-164.] |
| [51] |
Li L, Zhang QQ, Li H et al. The status of natural vegetation water demand in the Kezi River Basin in recent over 28 years. Arid Zone Research, 2021, 38(4): 1075-1084. [李骊, 张青青, 李宏等. 近28 a克孜河流域天然植被需水满足程度研究. 干旱区研究, 2021, 38(4): 1075-1084.] |
| [52] |
Geng SB, Shi PL, Song MH et al. Diversity of vegetation composition enhances ecosystem stability along elevational gradients in the Taihang Mountains, China. Ecological Indicators, 2019, 104: 594-603. DOI:10.1016/j.ecolind.2019.05.038 |
| [53] |
De Keersmaecker W, Lhermitte S, Honnay O et al. How to measure ecosystem stability? An evaluation of the reliability of stability metrics based on remote sensing time series across the major global ecosystems. Global Change Biology, 2014, 20(7): 2149-2161. DOI:10.1111/gcb.12495 |
| [54] |
Chi YG, Xu ZW, Zhou L et al. Differential roles of species richness versus species asynchrony in regulating community stability along a precipitation gradient. Ecology and Evolution, 2019, 9(24): 14244-14252. DOI:10.1002/ece3.5857 |
 2024, Vol. 36

