通常采用基于物种丰富度(species richness)和均匀度(evenness)的生物指数(如物种数、Shannon-Wiener多样性指数等)来对生物群落多样性进行评估[1-3].然而,传统的生物指数往往受到采样力度、采样方法以及生境类型等诸多因素的强烈影响,这使得生态学工作者难以比较那些来源不同的生物数据.此外,这些指数在人为干扰条件下往往产生不一致的变化,以致不能有效地运用它们来评估人为干扰对生物多样性的影响[4].许多学者也指出,在进行生物多样性评估时,物种丰富度、物种丰度的传统生物指数只是反映了生物多样性的一个侧面,同时还应该考虑到不同生物群落中各物种之间的进化和亲缘关系[5-6].
基于这种情况,Warwick和Clarke[7-8]提出了分类学差异性指数(TDI, taxonomic distinctness indices).这些指数在评估生物多样性时,有效地考虑到了群落中不同物种之间的进化关系[9-11].当生物群落受到人为干扰时,生物群落的这种进化关系会发生改变,从而可以应用分类学差异性指数来评估人类活动干扰的影响.此外,它们还具有受采样方法和采样力度影响小、只需要物种的有无数据、可对每个样点的该指数值进行置信区间检验等一系列优点[12-15],因此,这一指数在海洋、淡水、陆地等诸多领域的生物评价工作中均得到了广泛的应用[16-18].
目前,国外已开展了不少关于鱼类分类学多样性的研究[4, 19-20],而国内只是在近些年才陆续有个别学者进行研究,仅徐宾铎等[21-22]、黄良敏等[23]和沈新强等[24]分别对黄、渤海、厦门海域和长江口的鱼类群落分类学多样性进行了研究.但是,针对淡水生态系统,尤其是淡水湖泊的鱼类分类学多样性的研究却鲜有报道[25],因此非常有必要针对淡水湖泊鱼类,开展这一系列指数的研究.
长江中下游湖群是我国五大湖区之一,拥有丰富的鱼类生物多样性,占到世界已知鱼类物种数的3%.近半世纪以来,由于江湖阻隔、过渡捕捞以及环境污染等因素对长江及其湖泊生态系统的鱼类多样性造成了严重的威胁.洪湖是长江中游大型浅水湖泊,亦面临着同样的问题.由于人为因素和自然环境变迁,洪湖的鱼类群落结构发生较大变化,出现了鱼类种类组成和种群结构小型化、鱼类多样性下降等局面[26-28].目前基于传统的物种丰富度的分析表明洪湖鱼类群落多样性有下降趋势,而未见有鱼类群落分类学多样性长期变动的报道.然而,不同时期的鱼类调查往往难以保证采样力度的一致性,因此,开展洪湖鱼类分类学差异性的研究有着显著的科学意义.本研究系统地收集了洪湖自1950s以来历史资料和野外调查数据,研究洪湖鱼类分类学差异性指数的变动,从而为科学管理洪湖鱼类资源提供依据.
1 材料与方法 1.1 研究水域洪湖(29°42′~29°58′N, 113°13′~113°29′E)横跨湖北省东南部洪湖、监利二市,是长江和汉水支流之间的洼地区域,东南距长江仅4 km.洪湖原为通江湖泊,水位随长江水位涨落,生物资源明显受长江干流影响.但自1950s以来,洪湖湖区掀起了空前规模的围湖造田和大兴水利建设活动.随着洪湖围堤和节制闸先后的建成,使得洪湖与长江发生阻隔,二者之间的生物交流受到阻碍,洪湖生态功能下降,生物多样性减少[28].
1.2 数据来源洪湖鱼类物种和分布数据以正式发表的学术论文以及专著为主,鱼类名录来自于洪湖有记录以来的所有文献和各种调查资料[26-27, 29].本研究选取记录洪湖从1950s到目前为止的鱼类群落状况的资料,包括1959、1964、1981、1993和2004年.因各时期采样方法和采样力度的不一致性,丰度数据往往缺乏可比性,一般也转化为物种有无数据进行分析.
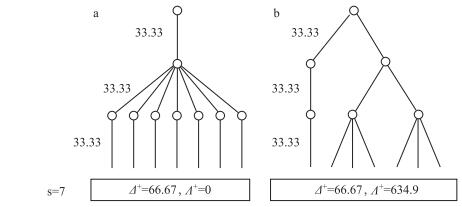
1.3 数据处理本文主要根据Nelson[30]系统,建立洪湖较为全面的鱼类分类组成,10个分类等级水平为:种、属、亚科、科、超科、亚目、目、系、超目、亚组.本文采用以下两个分类学多样性指数:平均分类差异性指数(Δ+)和变异分类差异性指数(Λ+). Δ+代表着一个样方中,通过分类学进化树连接任意两个物种间的平均路径长度,Δ+的变化表明分类学进化树的平均路径长度的变化;Λ+则是这些物种间路径长度的方差,反映着分类学进化树的均匀度(evenness),Λ+的上升表明分类学进化树变得越来越不均匀(图 1). Δ+和Λ+的计算公式分别为:

|
图 1 两个具有相同平均分类差异性指数(Δ+)值和不同的变异分类差异性指数(Λ+)值的分类树: a反映了一个完全均匀分布的分类树,b反映了一个高度不均匀分布的分类树(修改自文献[11]) Fig.1 Two examples taxonomic trees (a, b) which result in exactly the same average taxonomic distinctness (Δ+) index value, but very different variation in taxonomic distinctness (Λ+) value: a shows a highly even taxonomic tree, whereas b reflects a very uneven taxonomic tree |
| ${\mathit{\Delta }^ + } = \left[ {\Sigma {\Sigma _{i < j}}{\omega _{ij}} \cdot {x_i} \cdot {x_j}} \right]/\left[ {S(S - 1)/2} \right]$ | (1) |
| ${\mathit{\Lambda }^ + } = \left[ {\Sigma {\Sigma _{i < j}}{{({\omega _{ij}} - {\mathit{\Delta }^ + })}^2}} \right]/\left[ {S(S - 1)/2} \right]$ | (2) |
式中, ωij为分类树上联接物种i和物种j枝长的权重,S为物种数目[6-7].
根据Clarke等[10]的方法,本研究中将分类树中最大距离的权重ω设置为100,每个分类等级的枝长享有同样的权重.但是由于某些分类阶元(如亚科、超科)并非对所有种类均适用(如鲤科的鱼类通常都有亚科的归属,而鲶形目的鱼类则一般无亚科的分类概念),因此需要对亚科、超科、亚目等分类阶元设置权重.这里参照Tolimieri等[20]的权重设置方法,某一分类阶元的枝长权重设置为有该分类阶元定义的物种的百分比.例如一个群落中如果78%的物种有亚科,22%的物种没有亚科,那么亚科阶元枝长的权重就设置为0.78.本研究中用来计算分类差异性指数的每个分类阶元的权重和枝长见表 1.
| 表 1 计算分类差异性指数的各分类阶元的权重和枝长 Tab.1 Weights and branch lengths used for calculating average taxonomic distinctness and variation in taxonomic distinctness |
为了检验Δ+和Λ+的统计学意义,采用零假设模型在区域的物种库中进行随机抽样统计Δ+和Λ+预测值及观测值之间的差别.这个区域的物种库由洪湖历史上出现的鱼类物种组成.从区域物种库中随机抽取物种计算Δ+和Λ+,生成预测值95%的置信区间,并比较观测值在置信区间中的位置.如果观测值在95%置信区间之外,说明此时的分类差异性指数有显著上升或者降低的变化.
此外,本研究还计算Sørensen相似性指数得到洪湖5个时期鱼类物种组成的相似距离矩阵,采用非度量多维标度排序(Non-metric Multidimensional Scaling, NMDS)构建排序图.分类差异性指数的分析和计算和NMDS分析均采用统计分析软件PRIMER v6.1完成[31]. Sørensen相似性指数的计算公式为:
| ${\rm{Sørensen}}相似性指数 = 2a/(2a + b + c)$ | (3) |
式中, a为2个群落共有的种类数,b和c为各自特有的种类数[32].
2 结果 2.1 分类组成与变迁洪湖鱼类1950-2004年的物种库共包含了79个物种,隶属于9目18科55属. 5个时期的鱼类各分类阶元的数目均在1964年最高,1959年次之,2004年最低,大体上呈现出随时间推移物种多样性降低的趋势(表 2).各分类阶元数目的变化趋势表现出一定的差异性:种、属在1981年即明显下降,而科以上的分类阶元则在1993年才表现出下降的趋势.
| 表 2 洪湖鱼类各分类阶元在5个时期的变迁情况 Tab.2 Number of taxa at each taxonomic resolution level of fishes in Lake Honghu for the five time periods |
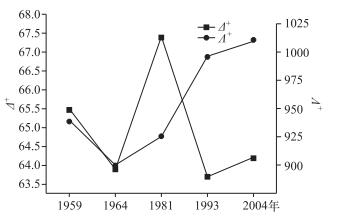
分析洪湖鱼类5个时期的分类差异性指数,发现Δ+表现出先上升后下降的趋势,而Λ+则表现出先下降后上升的趋势(图 2).

|
图 2 洪湖1959-2004年5个时期Δ+和Λ+值的变化 Fig.2 Temporal variations in Δ+ and Λ+ of fish fauna in Lake Honghu during 1959-2004 |
观察Δ+和Λ+值对应物种数的95%置信区间漏斗图,发现5个时期的Δ+值都位于置信区间内,而1993和2004年的Λ+却位于置信区间的上方(图 3),表现出较随机抽样更高的Λ+值.

|
图 3 洪湖鱼类1959-2004年5个时期Δ+和Λ+值的对应物种数的95%置信区间漏斗图 Fig.3 Funnel plots showing taxonomic distinctness (Δ+) and variation in taxonomic distinctness (Λ+) versus number of species observed for fish fauna in Lake Honghu during 1959-2004: The lines showing mean value and 95% confidence intervals were determined via random selection from the total master species lists |
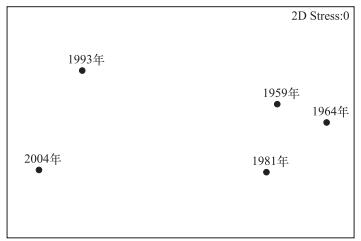
洪湖5个时期鱼类组成Sørensen相似性指数和NMDS排序图显示,1959、1964和1981年3个时期的鱼类群落组成较为类似,而1993和2004年与前3个时期相比,群落组成则发生了较大的变化(表 3,图 4). 1993和2004年洪湖的鱼类物种数下降较多,与前3个时期共有的物种数减少, Sørensen相似性指数的降低,导致1993和2004年鱼类的种类组成与前3个时期发生了较大变化.
| 表 3 洪湖不同时期鱼类群落组成的Sørensen相似性指数 Tab.3 Sørensen similarity index values based on fish assemblages among different periods |

|
图 4 洪湖鱼类群落5个时期的NMDS排序图 Fig.4 NMDS ordination plot based on species composition of fishes during five time periods in Lake Honghu |
在1960s以前,洪湖与长江干流直接相通,而在1960s以后,为了围垦和湖泊开发,水利设施的兴修阻断了洪湖与长江的天然联系,形成了江湖阻隔.江湖阻隔导致该湖泊水生生态系统由原来的开放系统走向一个封闭系统,阻断江湖之间物质、能量和有机物的交流[33],导致鱼类物种大量消失,特别是洄游和半洄游性鱼类濒危,从而显著改变湖泊内鱼类的种类组成[34-36].此外,调蓄、泄洪等人为因素使得洪湖周边地区的大量农田污水和有毒物质进入洪湖,导致水质变差、鱼类生存环境恶化.同时,洪湖捕捞业超负荷发展,过度捞取水草破坏了鱼类的摄食和繁殖,从而加剧洪湖鱼类资源衰退.这些活动使得洪湖原有的生态系统遭到了严重的破坏.
研究表明,近50年来人为活动干扰加剧导致洪湖的水质、生境状况和多样性水平都发生了退化[37],洪湖鱼类的物种丰富度和分类学差异性指数的响应和历史变迁. 1959-2004年,洪湖鱼类的物种数经历了明显的下降过程,但分类学差异性指数(Δ+和Λ+)的变化却与物种数的变化表现出不同的趋势,物种数与Δ+(r=-0.460, P=0.181)和Λ+(r=-0.612, P=0.060)的相关性均不显著.分类学差异性指数与物种丰富度这种弱相关的关系,表明分类学差异性指数揭示了与物种数不同侧面的生物多样性的信息[17-18].因度量和使用的简便性,物种数被广泛地应用在生物多样性评估和保护研究中[3, 38-39],但是也有许多学者指出该指数只反映了生物多样性的一个侧面[40-41].分类学差异性有效地反映了群落中不同物种之间的进化关系,因而在多样性评估中,其可以作为物种多样性指数的有效补充.
分类学差异性指数已经被广泛的研究证明是衡量生物群落退化的强有力的指标.首先,如Clarke等[8]所论述,当环境受到干扰时,生物群落中包含物种数较少的属、科等高级分类单元通常会最先消亡,而那些包含物种丰富的属、科的种类则能够保留,从而导致受干扰群落的分类学差异性指数降低.针对洪湖,1959和1964年调查所获得的数据基本可以代表受干扰之前鱼类群落状况,二者的Δ+和Λ+值也差别不大,只是因为1964年的调查更为充分,同属的物种包含更充分,反而Δ+值较1959年为低. 1981年的调查中,科以上的分类阶元数目未发生改变,只是属、种的数量有所减少.此外,一些物种较多的属的物种数量出现了下降:如鱊属(Acheilognathus)的种类数由5种减少到2种,拟鲿属(Pseudobagrus)由3种减少到0种,这就意味着群落中那些具有最短的分类学距离的物种的消失,从而导致了Δ+值的升高.而随着时间推移,干扰强度的增加,物种数较少的科、目如鳗鲡目(仅含日本鳗鲡Anguilla japonica一种)、鲀形目(仅暗色东方鲀Takifugu obscurs)、鲱形目(仅刀鲚Coilia nasus)在1993和2004年的调查中消失,从而导致了Δ+值的降低.
研究发现,1993和2004年的Δ+值均位于漏斗图的置信区间内,但是,前3个时期的Δ+均明显在平均值的上方,而1993和2004年的Δ+值已接近平均值.这表明随着人为干扰的加剧,Δ+在一定程度上表现出下降的趋势,尽管这种下降未达到统计学上的显著性水平.这可能与洪湖目前的生态环境状况有关,相比长江中下游的其他湖泊,洪湖仍然保持了草型湖泊的状态,遭受的破坏程度相对较轻.在2004年的调查中尽管渔获物下降明显,但仍然有6目13科35属42种鱼类,因此在漏斗图中1993和2004年的Δ+值依然处于置信区间内.而1993和2004年的Λ+值位于置信区间外,意味着鱼类群落分类学进化树均匀度显著下降.
本研究还发现了洪湖鱼类Λ+随时间推移上升的趋势,表明了分类学进化树均匀度的下降.洪湖鱼类群落中,种类最丰富的鲤形目和鲈形目比例均随时间有所上升;而种类最丰富的科中,鲤科的比例由1959和1964年的60.3%上升到1993和2004年的64.3%,鲿科的比例则有所下降(表 4).这种某单一的科或目物种比例的上升,进而使进化树的均匀性下降,是导致Λ+上升的原因[16, 18].在Λ+漏斗图中,1993和2004年的Λ+值都显著高出了95%置信区间,也表明这一指数在未来环境评价中具有较好的应用前景[42].
| 表 4 洪湖鱼类群落种最丰富的目和科的种类百分比 Tab.4 The richness proportion of the species-richest orders and families of fish assemblage in Lake Honghu |
通过对洪湖1959-2004年鱼类分类学多样性的分析,发现Δ+和Λ+值的变化揭示了与物种数变化所蕴含的不同的信息,尤其是Λ+随时间推移上升的趋势,表明了这一指数随干扰程度的加剧而增加,因而可以作为环境评价的一个较好的工具.此外,与传统的生物多样性指数不同的是,Δ+和Λ+受采样方法和采样强度的影响较小,它们的计算只需要物种的有无数据,不考虑种类密度,对数据的要求较低.因此,该指数非常适合对来源不同的生物数据进行比较[43].需要注意的是,运用这两个指数进行置信区间检验时,区域物种库的构建对置信检验的准确性非常关键.在今后鱼类多样性研究和评价中,建议应当推广分类学多样性指数的应用.
| 附录 不同年代洪湖鱼类名录 Appendix Fish species collected in Lake Honghu at different periods |
| [1] |
Gaston K ed. Species richness: Measure and measurement. In: Biodiversity: A biology of numbers and difference. Oxford: Blackwell Science, 1996: 77-113.
|
| [2] |
Costello M, Bouchet P, Emblow C et al. European marine biodiversity inventory and taxonomic resources: State of the art and gaps in knowledge. Marine Ecology-Progress Series, 2006, 316: 257-268. DOI:10.3354/meps316257 |
| [3] |
Magurran A. Measuring biological diversity. Oxford: Blackwell Science, 2004.
|
| [4] |
Rogers S, Clarke K, Reynolds J. The taxonomic distinctness of coastal bottom-dwelling fish communities of the North-east Atlantic. Journal of Animal Ecology, 1999, 68: 769-782. DOI:10.1046/j.1365-2656.1999.00327.x |
| [5] |
Harper J, Hawksworth D. Biodiversity: Measurement and estimation. Philosophical Transactions of the Royal Society of London: Series B: Biological Sciences, 1994, 345: 45-58. DOI:10.1098/rstb.1994.0085 |
| [6] |
Clarke K, Warwick R. A taxonomic distinctness index and its statistical properties. Journal of Applied Ecology, 1998, 35: 523-531. DOI:10.1046/j.1365-2664.1998.3540523.x |
| [7] |
Warwick R, Clarke K. Taxonomic distinctness and environmental assessment. Journal of Applied Ecology, 1998, 35: 532-543. DOI:10.1046/j.1365-2664.1998.3540532.x |
| [8] |
Clarke K, Warwick R. A further biodiversity index applicable to species lists: Variation in taxonomic distinctness. Marine Ecology Progress Series, 2001, 216: 265-278. DOI:10.3354/meps216265 |
| [9] |
Heino J, Soininen J, Lappalainen J et al. The relationship betweens pecies richness and taxonomic distinctness in freshwater organisms. Limnology and Oceanography, 2005, 50: 978-986. DOI:10.4319/lo.2005.50.3.0978 |
| [10] |
Clarke K, Warwick R. The taxonomic distinctness measure of biodiversity: Weighting of step lengths between hierarchical levels. Marine Ecology Progress Series, 1999, 184: 21-29. DOI:10.3354/meps184021 |
| [11] |
Clarke K, Warwick R. Change in marine communities. An approach to statistical analysis and interpretation. Plymouth, United Kingdom: PRIMER-E Ltd, 2001.
|
| [12] |
Leonard D, Clarke K, Somerfield P et al. The application of an indicator based on taxonomic distinctness for UK marine biodiversity assessment. Journal of Environmental Management, 2006, 78: 52-62. |
| [13] |
Prato S, Morgana J, Valle L et al. Application of biotic and taxonomic distinctness indices in assessing the ecological quality status of two coastal lakes: Gaprolace and Foglino Lakes (Central Italy). Ecological Indicators, 2009, 9: 568-583. DOI:10.1016/j.ecolind.2008.06.004 |
| [14] |
Xu H, Jiang Y, Al-Rasheid K et al. Application of an indicator based on taxonomic relatedness of ciliated protozoan assemblages for marine environmental assessment. Environmental Science and Pollution Research, 2011, 18: 1433-1441. DOI:10.1007/s11356-011-0503-7 |
| [15] |
Zhao L, Xu Y, Yang Z, Xu G et al. Sampling effort of periphytic diatoms for bioassessment research using taxonomic distinctness in marine ecosystems: A case study in coastal waters. Marine Pollution Bulletin, 2016. http://dx.doi.org/10.1016/j.marpolbul.2016.08.008.
|
| [16] |
Zintzen V, Anderson M, Roberts C et al. Increasing variation in taxonomic distinctness reveals clusters of specialists in the deep sea. Ecography, 2011, 34: 306-317. DOI:10.1111/ecog.2011.34.issue-2 |
| [17] |
Heino J, Mykrä H, Hämäläinen H et al. Responses of taxonomic distinctness and species diversity indices to anthropogenic impacts and natural environmental gradients in stream macroinvertebrates. Freshwater Biology, 2007, 52: 1846-1861. DOI:10.1111/fwb.2007.52.issue-9 |
| [18] |
Jiang X, Song Z, Xiong J et al. Can excluding non-insect taxa from stream macroinvertebrate surveys enhance the sensitivity of taxonomic distinctness indices to human disturbance?. Ecological Indicators, 2014, 41: 175-182. DOI:10.1016/j.ecolind.2014.01.036 |
| [19] |
Mouillot D, Laune J, Tomasini JA et al. Assessment of coastal lagoon quality with taxonomic diversity indices of fish, zoobenthos and macrophyte communities. Hydrobiologia, 2005, 550(1): 121-130. DOI:10.1007/s10750-005-4368-y |
| [20] |
Tolimieri N, Anderson M. Taxonomic distinctness of demersal fishes of the California current: Moving beyond simple measures of diversity for marine ecosystem-based management. Plos One, 2010, 5: 1-14. |
| [21] |
Xu Binduo, Jin Xianshi, Liang Zhenlin. Calculation of hierarchical diversity of fish in the Huanghai and Bohai seas. Periodical of Ocean University of China:Natural Science Edition, 2005, 35(1): 25-28. [徐宾铎, 金显仕, 梁振林. 对黄渤海鱼类等级多样性的推算. 中国海洋大学学报:自然科学版, 2005, 35(1): 25-28.] |
| [22] |
Xu Binduo, Ren Yiping, Ye Zhenjiang et al. The taxonomic diversity of fish community in the coastal waters of Qingdao. Periodical of Ocean University of China, 2007, 37(6): 907-910. [徐宾铎, 任一平, 叶振江等. 青岛近岸水域鱼类群落分类学多样性的研究. 中国海洋大学学报:自然科学版, 2007, 37(6): 907-910.] |
| [23] |
Huang Liangmin, Xie Yangjie, Li Jun et al. The taxonomic diversity of fish community in the coastal waters of Xiamen. Acta Oceanologica Sinica, 2013, 35(2): 126-132. [黄良敏, 谢仰杰, 李军等. 厦门海域鱼类群落分类学多样性的研究. 海洋学报, 2013, 35(2): 126-132.] |
| [24] |
Shen Xinqiang, Shi Yunrong, Chao Min et al. Analysis of taxonomic diversity of fish community in Yangtze River estuary. Progress in Fishery Sciences, 2013, 34(4): 1-7. [沈新强, 史赟荣, 晁敏等. 长江口鱼类群落分类学多样性变动的分析. 渔业科学进展, 2013, 34(4): 1-7.] |
| [25] |
Jiang Z, Brosse S, Jiang X et al. Measuring ecosystem degradation through half a century of fish species introductions and extirpations in a large isolated lake. Ecological Indicators, 2015, 58: 104-112. DOI:10.1016/j.ecolind.2015.05.040 |
| [26] |
Song Tianxiang, Zhang Guohua, Chang Jianbo et al. Fish diversity in Lake Honghu. Chinese Journal of Applied Ecology, 1999, 10(1): 86-90. [宋天祥, 张国华, 常剑波等. 洪湖鱼类多样性研究. 应用生态学报, 1999, 10(1): 86-90.] |
| [27] |
Lu Shan, Hu Junhua, Xiao Chengyun et al. Fish species composition in Lake Honghu and estimation of influencing factors. Chinese Wildlife, 2006, 27(6): 14-17. [卢山, 胡军华, 肖成云等. 洪湖鱼类物种组成及影响因素评价. 野生动物杂志, 2006, 27(6): 14-17.] |
| [28] |
Zhu Mingyong, Wang Xuelei, Ning Longmei. Ecological impacts of water conservancy activity to fish resources in Lake Honghu. Journal of Water & Water Engineering, 2008, 19(1): 32-35. [朱明勇, 王学雷, 宁龙梅. 水事活动对洪湖鱼类资源的生态影响. 水资源与水工程学报, 2008, 19(1): 32-35.] |
| [29] |
Chen Yiyu, Xu Yun, Wang Gan et al. Aquatic organisms and their resources development in Lake Honghu. Beijing: Science Press, 1995. [陈宜瑜, 许蕴, 王干等. 洪湖水生生物及其资源开发. 北京: 科学出版社, 1995.]
|
| [30] |
Nelson J ed. Fishes of the world. Hoboken, New Jersey: John Wiley & Sons Inc, 2006.
|
| [31] |
Clarke K, Gorley R. PRIMER v6: User Manual/Tutorial. Plymouth, United Kingdom: PRIMER-E Ltd, 2006.
|
| [32] |
Simpson E. Measurement of diversity. Nature, 1949, 163: 688. DOI:10.1038/163688a0 |
| [33] |
Amoros C, Bornette G. Connectivity and biocomplexity in waterbodies of riverine floodplains. Freshwater Biology, 2002, 47: 761-776. DOI:10.1046/j.1365-2427.2002.00905.x |
| [34] |
Wang Limin, Hu Huijian, Wang Ding. Ecological impacts of disconnection from the Yangtze on fish resources in Zhangdu Lake. Resources and Environment in the Yangtze Basin, 2005, 14(3): 287-292. [王利民, 胡慧建, 王丁. 江湖阻隔对涨渡湖区鱼类资源的生态影响. 长江流域资源与环境, 2005, 14(3): 287-292.] |
| [35] |
Heiler G, Hein T, Schiemer F. Hydrological connectivity and flood pulses as the central aspects for the integrity of a river-floodplain system. Regulated Rivers-Research and Management, 1995, 11: 351-361. DOI:10.1002/(ISSN)1099-1646 |
| [36] |
Welcomme R, Bene C, Brown C et al. Predicting the water requirements of river fisheries. In:Verhoeven JTA, Beltman B, Bobbink R et al eds. Wetlands and natural resource management. Berlin Heidelberg: Springer-Verlag, 2006:123-154.
|
| [37] |
Wu Hongyan, Cheng Dongsheng, Zhou Wenbing et al. Temporal and spatial analysis of water quality of Lake Honghu based on statistical interpolation methods. Journal of Huazhong Agricultural University, 2013, 32(3): 82-87. [吴红艳, 程东升, 周文兵等. 基于地统计学插值方法的洪湖水质时空状况分析. 华中农业大学学报, 2013, 32(3): 82-87.] |
| [38] |
Cadotte M, Carscadden K, Mirotchnick N. Beyond species: Functional diversity and the maintenance of ecological processes and services. Journal of Applied Ecology, 2011, 48: 1079-1087. DOI:10.1111/jpe.2011.48.issue-5 |
| [39] |
Strecker A, Olden J, Whittier J et al. Defining conservation priorities for freshwater fishes according to taxonomic, functional, and phylogenetic diversity. Ecological Application, 2011, 21: 3002-3013. DOI:10.1890/11-0599.1 |
| [40] |
Marchant R. The use of taxonomic distinctness to assess environmental disturbance of insect communities from running water. Freshwater Biology, 2007, 52: 1634-1645. DOI:10.1111/fwb.2007.52.issue-8 |
| [41] |
Devictor V, Mouillot D, Meynard C et al. Spatial mismatch and congruence between taxonomic, phylogenetic and functional diversity: The need for integrative conservation strategies in a changing world. Ecology Letters, 2010, 13: 1030-1040. |
| [42] |
Xu G, He C, Xu H et al. Application of taxonomic distinct-ness indices of littoral macroinvertebrate communities for assessing long-term variation in ecological quality status of intertidal ecosystems, northern China. Environmental Science and Pollution Research, 2012, 19: 3859-3867. DOI:10.1007/s11356-012-1017-7 |
| [43] |
Abellán P, Bilton D, Millán A et al. Can taxonomic distinctness assess anthropogenic impacts in inland waters? A case study from a Mediterranean river basin. Freshwater Biology, 2006, 51: 1744-1756. DOI:10.1111/fwb.2006.51.issue-9 |
 2017, Vol. 29
